Document Type Details
Document Type Details
The Document Type Details page contains general information about the document type, metrics and notifications for this document type. You can view/edit the document type details, view metrics and manage notifications. To access the Document Type Details, you need to be granted DocumentType-READ permission. See Role Permissions .
To access Document Type Details, you need to:
- Navigate to the Document Types module.
- Click on the corresponding Document Type Name.

Details
The Details tab displays general information and settings that are necessary for the Document Type.
You can view/edit the following information about a Document Type on the Details tab:
- Name - the Document Type name.
- Description - a short description of the Document Type.
- Human Task Type - the selected Human Task Type for the Document Type.
- Settings - information about the fields that should be retrieved from the documents + additional settings. See Document Type Settings JSON Structure.
- To save the result of editing click UPDATE.

Metrics
The Metrics tab allows users to view the graphs that visualize information about the Document Type human task statuses. To access the Metrics, you need to be granted DocumentType-READ permission. See Role Permissions.
Control icons
- Refresh - to refresh the metrics.
To display the data on a graph within a particular time range drop-down Time range can be used.
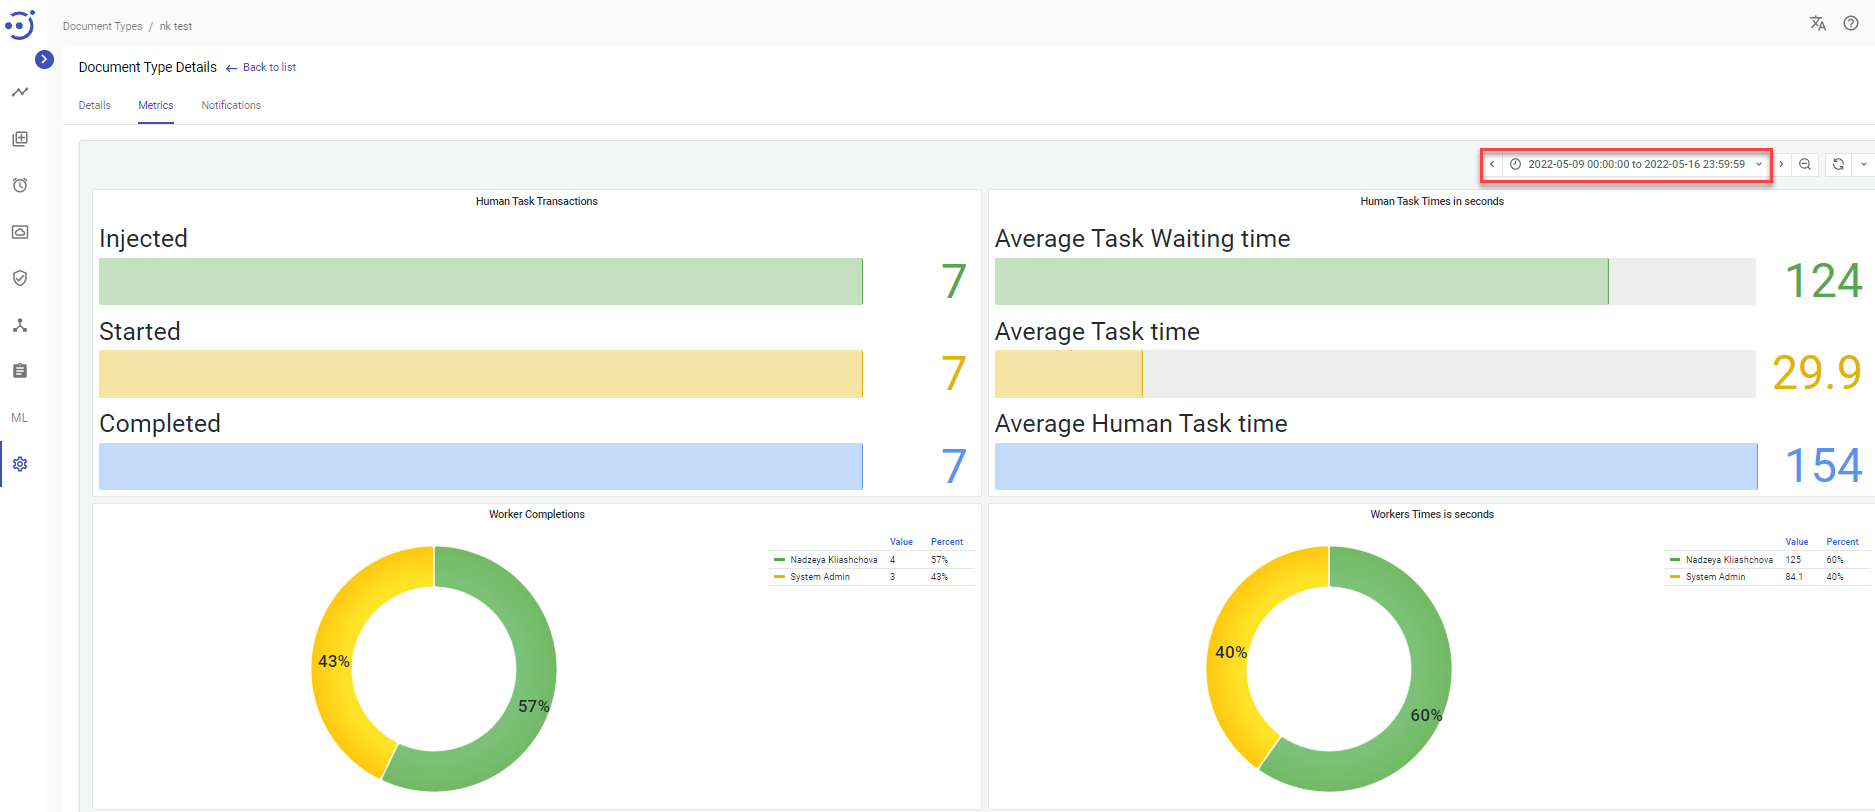
There are four graphs placed in the Metrics tab:
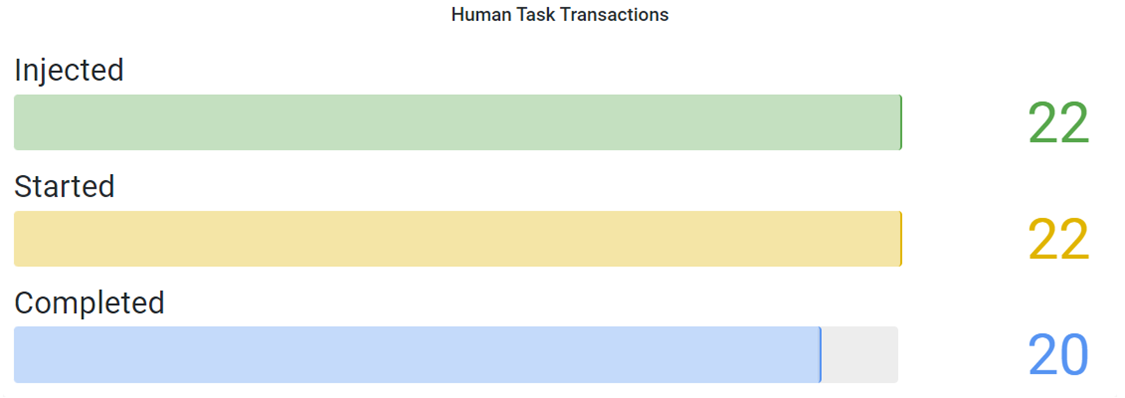
- Human Tasks Transactions - the graph shows the number (abscissa axis) of human task statuses (ordinate axis) that have been proceeded within the Document Type. The graph shows the total number of human task status transitions (Injected), as well as their breakdown by specific statuses such as: Started, Completed.
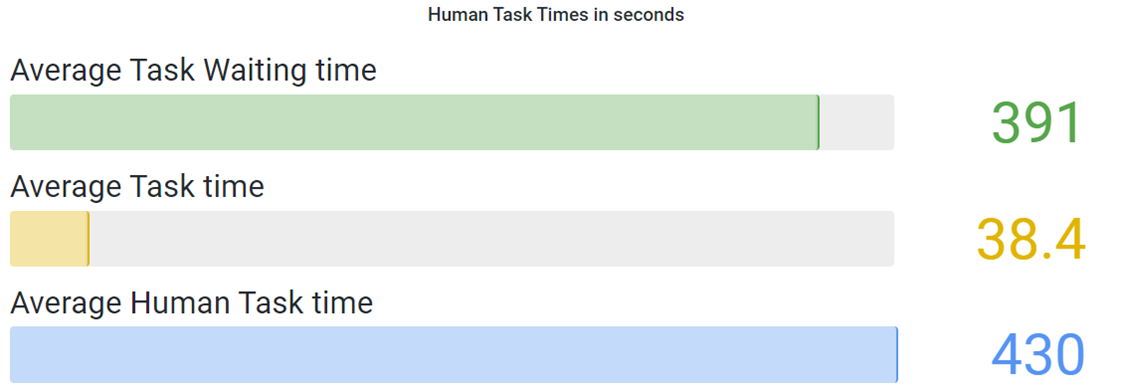
- Human Task Times in seconds - the graph shows the average time (abscissa axis) of human tasks cycle time (ordinate axis) within the Document Type. The graph shows the total average time to process human tasks (Average Human Task time), as well as their breakdown by task waiting time and execution time by a human: Average Task Waiting time, Average Task time. The components of the graph can be calculated according to the following formulas:
Average Task Waiting time = SUM(Time of transition of Human Tasks from Available to In Progress status in the specified time range)/The number of user tasks that have moved to In Progress status in the specified time range
Average Task time = SUM(Time of transition of Human Tasks from In Progress to Completed status in the specified time range)/The number of user tasks that have moved to Completed status in the specified time range
Average Human Task time = Average Task Waiting time + Average Task time
- Workers completions - the graph shows the percentage of the total number of human tasks within the Document Type completed by a particular worker. The graph legend displays the total value of completed human tasks and the percentage from total for a particular worker.
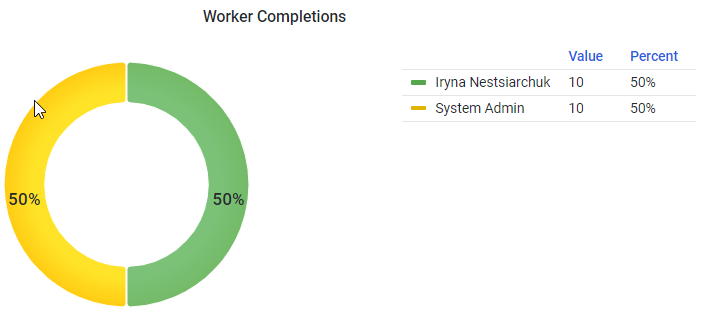
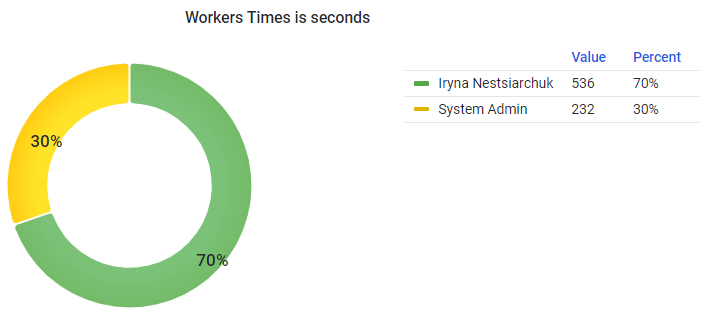
- Workers Time in seconds - the graph shows the percentage of the total time for human tasks within the Document Type spent by a particular worker. The graph legend displays the total value of human tasks time and the percentage from total for a particular worker.
Graphs display and location may vary depending on the settings. To setting graphs, you need to be granted Admin permission to Grafana. See Grafana Roles.
Notifications
The Notifications tab allows users to receive messages about a particular Document Type. To access the Notifications, you need to be granted DocumentType-READ permission. See Role Permissions.

Columns Description
- Trigger - the action for which the message is sent to the particular channel.
- Template - example of a message is sent to a channel. By clicking on the Template, you can see the Template Details.
- Channel - mailing list of contacts.
Control icons
- Refresh - to refresh the page.
- Delete - to delete the Notifications via the recycle bin control icon in the table row or Delete icon above the table.

Table Settings
Table settings allow you to manage the table view. Click the icon ![]() to start working with the table settings. The table settings can be managed with the following buttons:
to start working with the table settings. The table settings can be managed with the following buttons:
- Advanced filter - to switch the advanced filters for the columns.
- Columns Display - to select the columns that will be displayed in the table.
- Apply - to apply the changes made to the table settings.
- Сancel - to cancel the last actions with the table settings.
Filter by text
Filtering allows you to search the automation process by Trigger, Channel and Template.
Advanced filters by columns
Advanced Filter allows you to extract a list from a table with predefined criteria. Click the icon ![]() to start working with the advanced filter. The advanced filters can be managed with the following buttons:
to start working with the advanced filter. The advanced filters can be managed with the following buttons:
- Clear filter - to reset all the proposed advanced filter criteria for the column.
- Сancel - to cancel the last actions with the proposed criteria for the column.
Apply - to filter the table according to the proposed criteria for the column.
Sorting
Ascending/descending sorting is allowed for the columns: Channel, Template.
Grouping
Grouping is allowed for the Trigger column.
Create a New Notification
To create a New Notification:
- Click CREATE NEW button.
- On the New Notification pop-up panel enter Trigger, Chanel, Template.

- Click CREATE.
To create the Document Type Notifications, you need to be granted DocumentType-UPDATE permission. See Role Permissions.
Update Notifications
To Update an existing notification parameters, you need to:
- Click on the corresponding notification.
- On the Edit Notification pop-up panel change one of the field values.

- Click UPDATE.
To update the Node Notifications, you need to be granted DocumentType-UPDATE permission. See Role Permissions.
Delete Notifications
There 2 ways to Delete Notifications:
- Click control icon Delete in the row.

- Choose the particular (or all) Notification and click icon Delete above the table.

You need to be granted DocumentType-UPDATE permission. See Role Permissions.