Monitoring
Monitoring
The Monitoring module allows real-time overview of the Control Server's system indicators and system indicators during the OCR process and ML models execution. To access the Metrics, you need to be granted Administration-READ permission. See Role Permissions.
Control icons
- Refresh
 - to pull the latest changes.
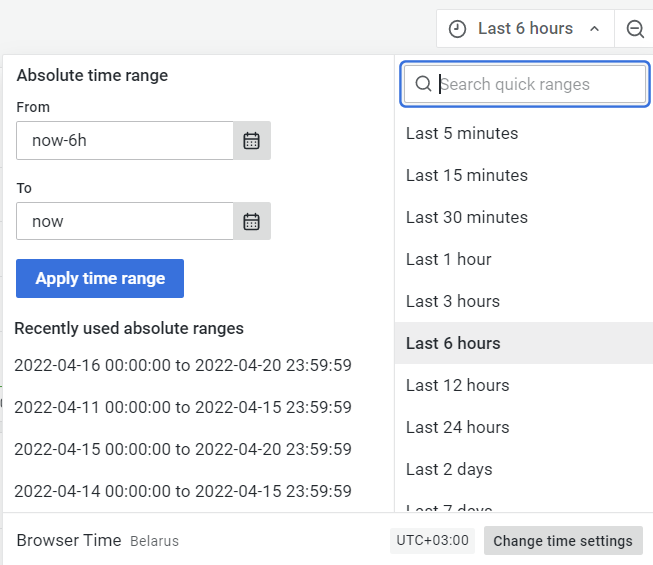
To display the data on a graph within a particular time range drop-down Time range can be used.
Hotkeys to manipulate the graph view
To update the view the following hotkeys can be used:
- CTRL or CMD - Press the hotkey and select/deselect the necessary data to be displayed on the graph.
- To zoom in the particular time range use the mouse selection.
OCR
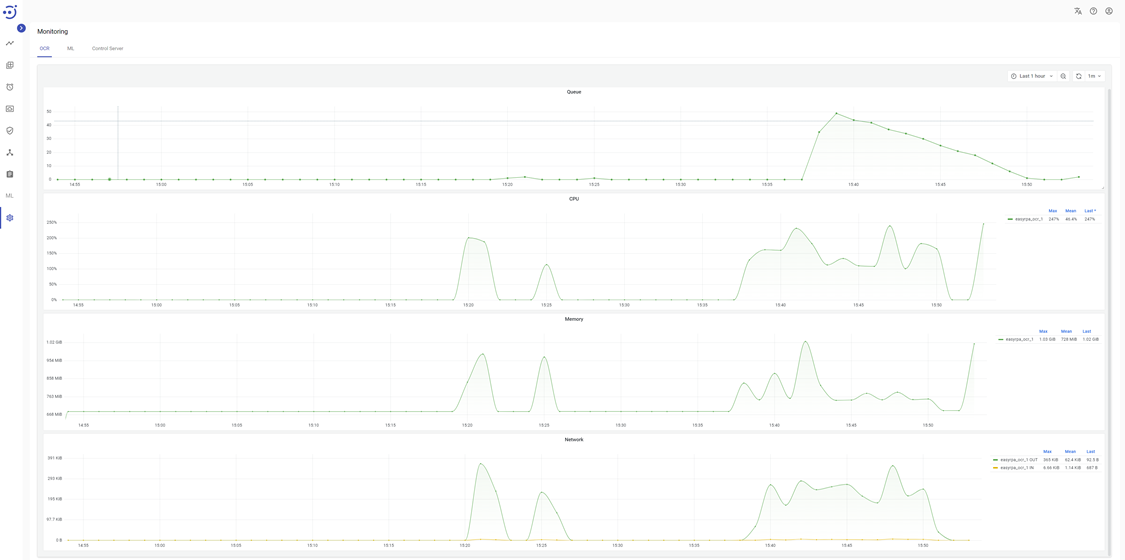
There are four graphs placed in the OCR tab, which show system indicators during OCR processes executing:
- Queue - the graph shows the number of the queued Documents in OCR container (ordinate axis) during the selected time range (abscissa axis).
- CPU - the graph shows the percentage of the CPU which the OCR container utilizes (ordinate axis) during the selected time range (abscissa axis).
- Memory - the graph shows the Memory which the OCR container utilizes (ordinate axis) during the selected time range (abscissa axis).
- Network - the graph shows the Network which the OCR container utilizes (ordinate axis) during the selected time range (abscissa axis).
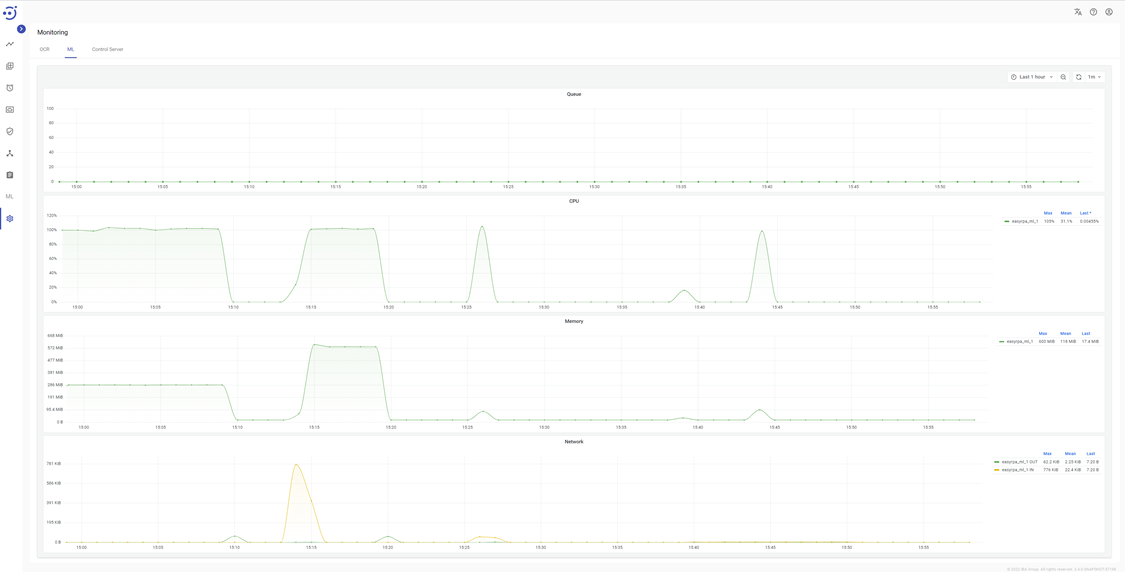
ML
There are four graphs placed in the ML tab, which show system indicators during ML models executing.
- Queue - the graph shows the number of the queued Documents in ML container (ordinate axis) during the selected time range (abscissa axis).
- CPU - the graph shows the percentage of the CPU which the ML container utilizes (ordinate axis) during the selected time range (abscissa axis).
- Memory - the graph shows the Memory which the ML container utilizes (ordinate axis) during the selected time range (abscissa axis).
- Network - the graph shows the Network which the ML container utilizes (ordinate axis) during the selected time range (abscissa axis).
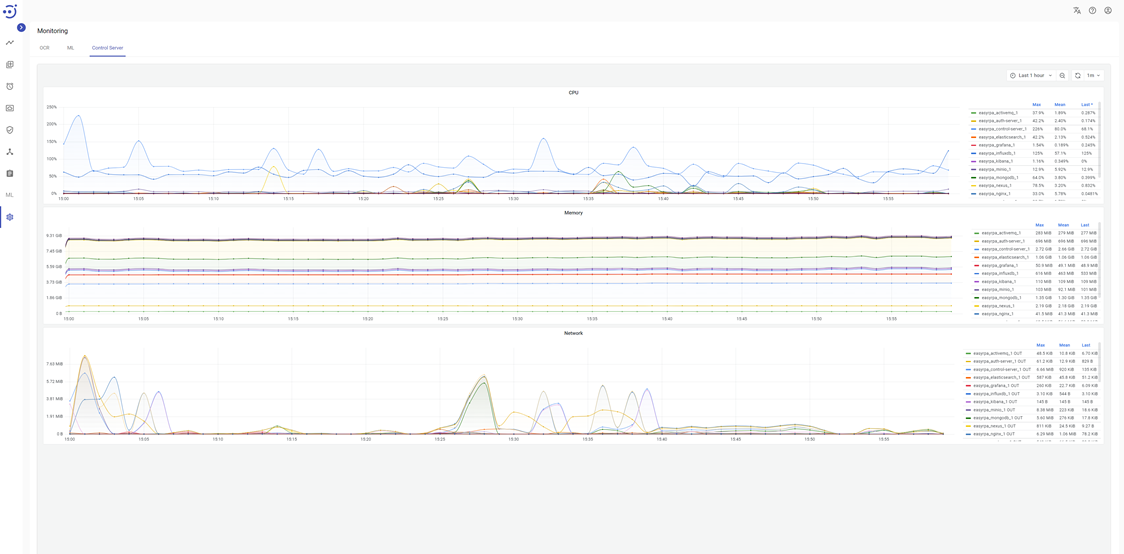
Control Server
- CPU - the graph shows the percentage of the CPU which each CS container utilizes (ordinate axis) during the selected time range (abscissa axis).
- Memory - the graph shows the Memory which each CS container utilizes (ordinate axis) during the selected time range (abscissa axis).
- Network - the graph shows the Network which each CS container utilizes (ordinate axis) during the selected time range (abscissa axis).