Metrics
Metrics
The Metrics tab displays graphs that illustrate information about model execution metrics. To access the Metrics, you need to be granted DocumentSet-READ permission. See Role Permissions.
Control icons
- Refresh - to refresh the metrics.
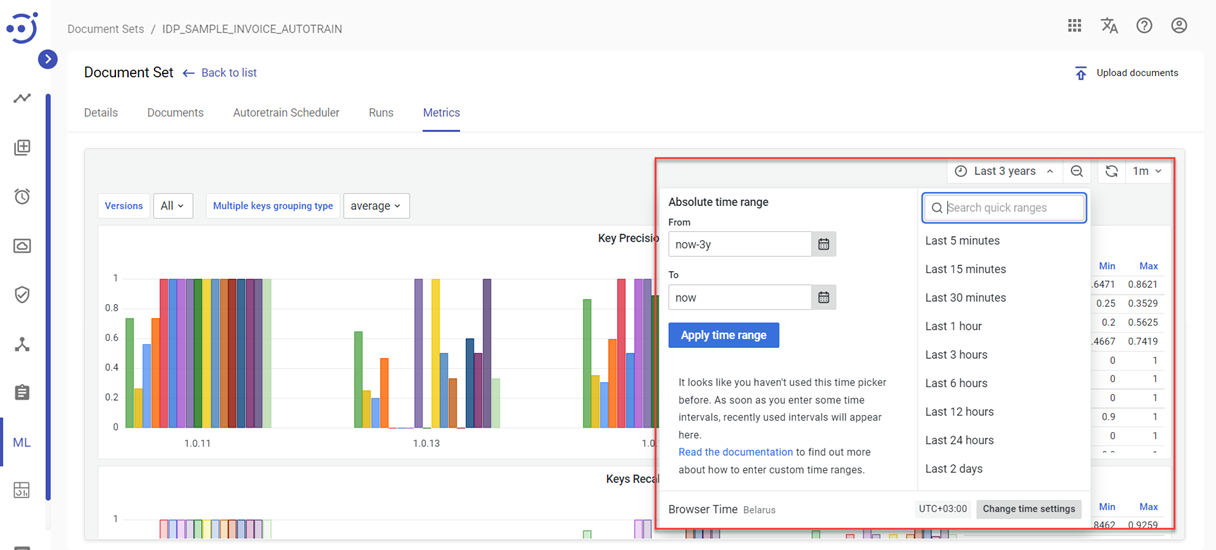
- To display the data on a graph within a particular time range drop-down Time range can be used.
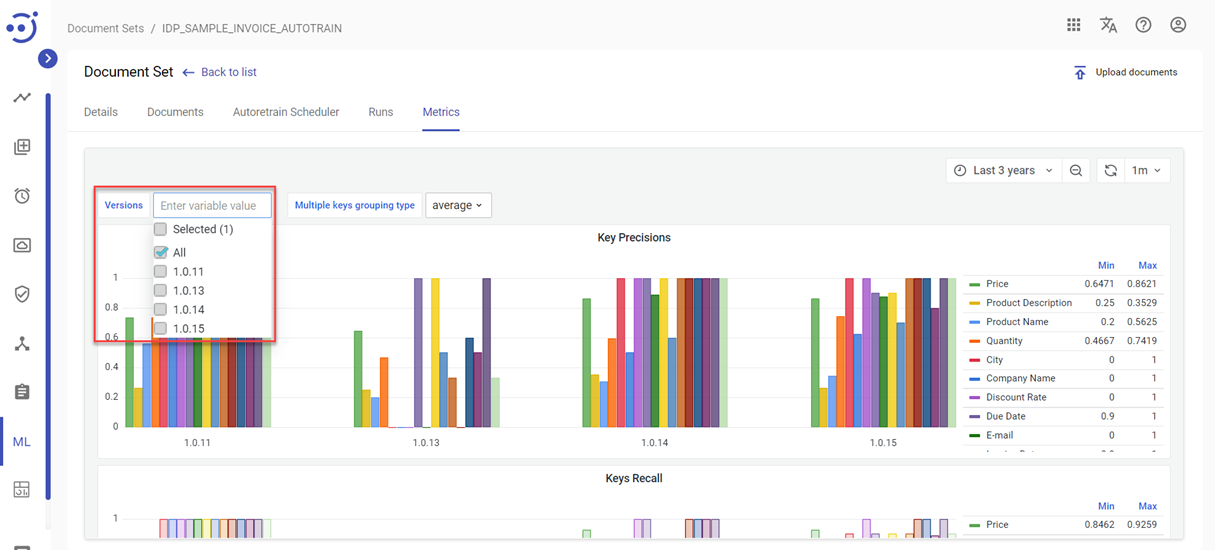
You can use Versions drop-down menu to view metrics of specified model or models.
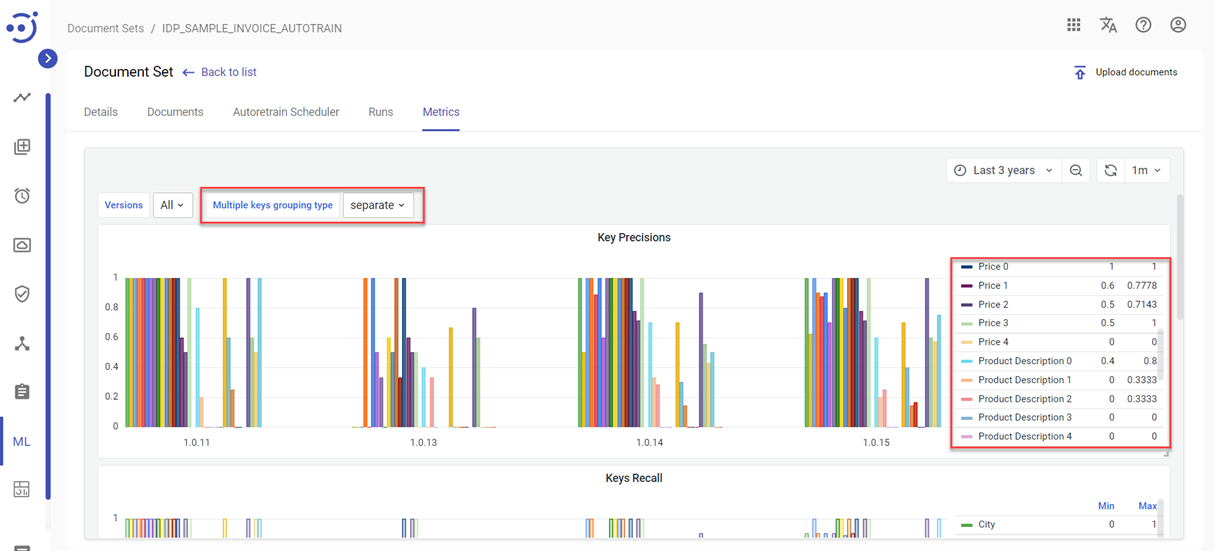
Multiple keys grouping type drop-down menu is used to customize the display of group fields metrics.
Choosing the Separate value option will display the values of the group fields as separate graph elements or values in the table.
The Average value option displays a single graph or a value in the table representing the arithmetic average of the group field values.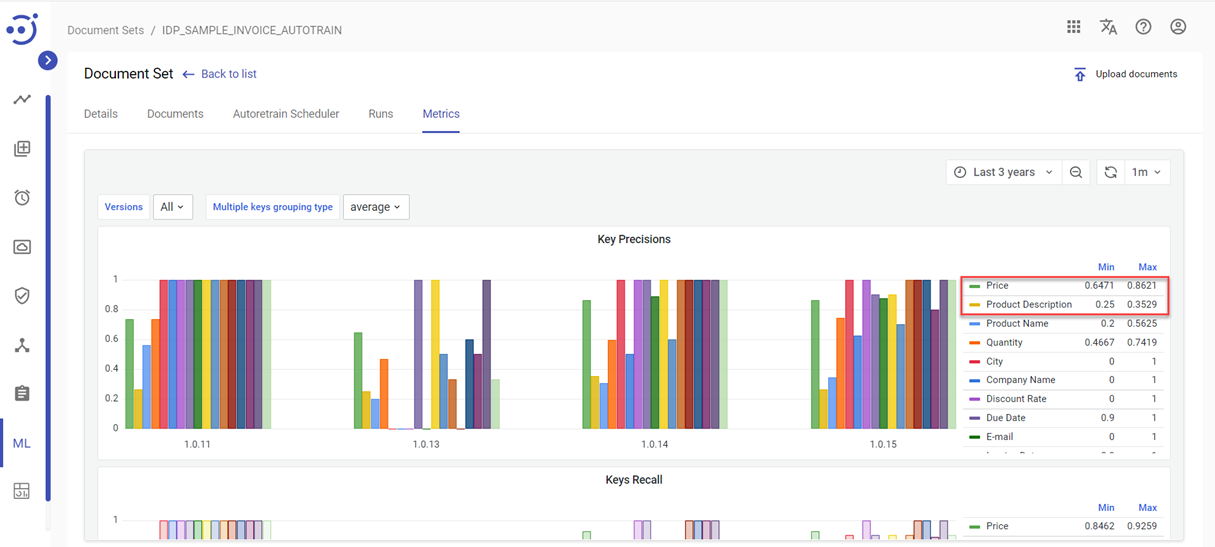
There are five graphs placed in the Metrics tab:
Key Precisions - the graph shows Precision of extracted fields(abscissa axis) of specified model(ordinate axis). For more info on Precision see Precision.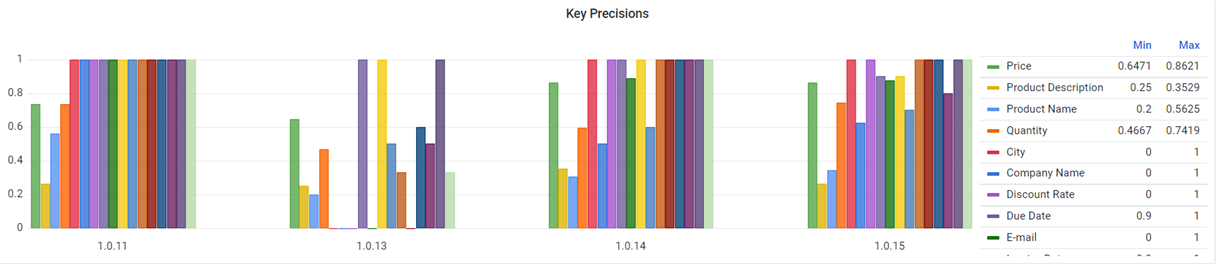
Keys Recall - the graph shows Recall of extracted fields(abscissa axis) of specified model(ordinate axis). For more info on Recall see Recall.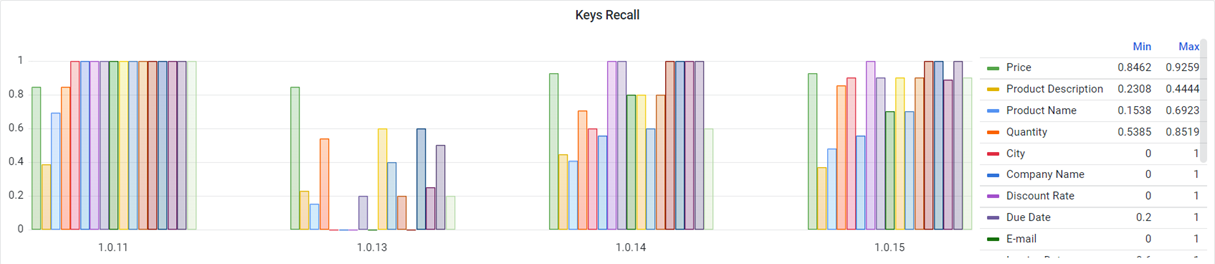
Key values - table shows both extracted fields Precision and Recall in numerical representation of specified model.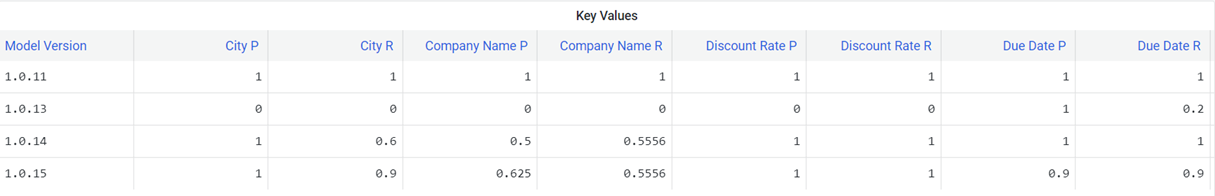
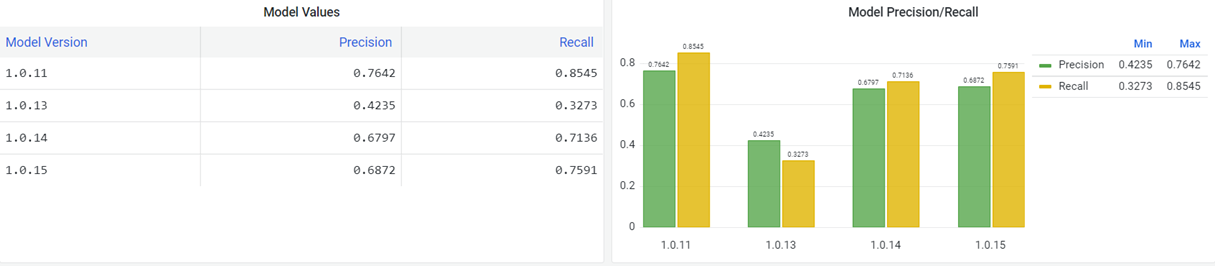
Model values - table shows average Precision and Recall in numerical representation of specified model.
Model Precision/Recall - the graph shows ratio of Precision to Recall of extracted fields(abscissa axis) of specified model(ordinate axis).