Analysis of result
Analysis of result
We should examine how well the model classifies objects in order to evaluate the model's performance.
For that, run the model on the test set and verify that it is correctly classified.
Binary classification
If both of two classes (class A and class B, for example) are equally interesting for you, there are four possible results: true positive (correctly predicts class A), false positive (incorrectly predicts class A), true negative (correctly predicts class B), and false negative (incorrectly predicts class B). Each of these outcomes have different implications for the accuracy of the model, so it is important to understand the implications of each result.
Predicted class red squares | Predicted class blue circles | |
Actual class red squares | Correctly classified red squares | Incorrectly classified red squares |
Actual class blue circles | Incorrectly classified blue circles | Correctly classified blue circles |
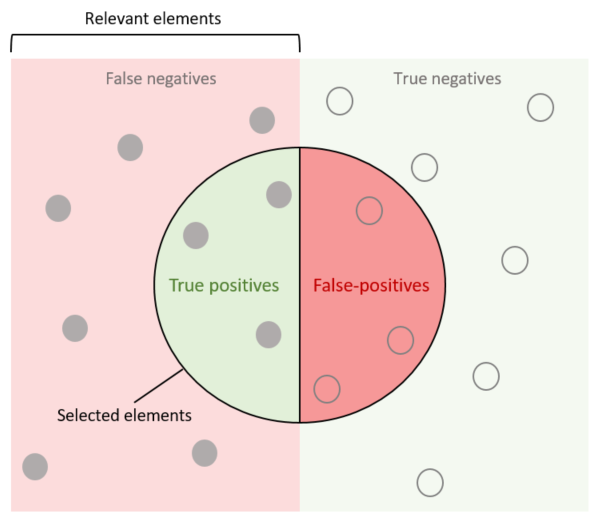
As you can see, it is necessary to separate correctly classified objects from incorrectly classified objects in this case. They are true answers and false answers. Objects of two classes are usually called positives(objects of the first class, for example, red squares) and negatives(objects of the second class, for example, blue circles):
- True positives (TP) and true negatives (TN) are objects of the first and second classes classified correctly.
- False positives (FP) and false negatives (FN) are objects of the first and second classes classified incorrectly. If you are more interested in one class, for, example, you have an invoice or not invoice classification and want to process invoices(target class, relevant elements) further, the classification results look as follows:
Confusion matrix is the table-form distribution that looks like this:
Predicted class red squares | Predicted class blue circles | |
Actual class red squares | TP | FN |
Actual class blue circles | FP | TN |
Binary classification metrics
Precision
Precision attempts to answer the following question:
| What proportion of positive identifications was actually correct? |
|---|
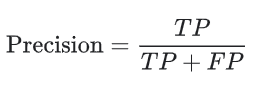
Precision (calculated per class only) shows how exact the classification is. Among all the red squares defined by the model that actually belong to this class. Precision is calculated in the following way:
Recall
Recall attempts to answer the following question:
| What proportion of actual positives was identified correctly? |
|---|
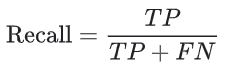
Recall (calculated per class only) shows how complete the classification is. This is how many red squares have been classified as red squares. Recall is calculated in the following way:
Accuracy
Accuracy refers to the percentage of correct predictions our model makes. Accuracy can be defined as follows:
Accordingly, binary classification accuracy can also be calculated using positives and negatives:
Multiclass classification
In the previous case of binary classification, there were only two classes, namely Positive and Negative. In multiclass classification, there are two possible options for assigning Positive or Negative, True or False relevance to classes:
For each class, define true or false values separately (analyze only TPs and FPs). Confusion matrix for this method will look as follows:
Actual classA B C Predicted class A True A False A False A B False B True B False B C False C False C True C So Precision and Recall for separate classes will be calculated as follows:
A-class B-class C-class Precision Sum(True A) ÷ Sum(True A, False A) Sum(True B) ÷ Sum(True B, False B) Sum(True C) ÷ Sum(True C, False C) Recall Sum(True A) ÷ Sum(True A, False B classified as A, False C classified as A) Sum(True B) ÷ Sum(True B, False A classified as B, False C classified as B) Sum(True C) ÷ Sum(True C, False A classified as C, False B classified as C) Identify one major class and treat the others (negatives, irrelevant) as aggregated class. Confusion matrix for this method will look as follows:
Actual classA Other Classes Predicted class A True Positive False Positive Other Classes False Negative True Negative Therefore, Precision and Recall for major classes will be calculated similarly to binary classification.
Information Extraction
The results of information extraction models can also be classified into TPs, FPs, TNs, and FNs.
There are two new metrics in the Information Extraction process:
Gold value - the amount of objects that should be extracted;
Extracted values - amount of extracted objects.
The IE model’s quality is estimated by comparing gold data and extraction results received after applying a particular model.
- True positive: The value should be extracted and was extracted correctly(result=gold≠empty).
- False positive: The value should not be extracted(gold=empty) but was extracted(result≠empty).
- True negative: The value should not be extracted(gold=empty) and was not extracted(result=empty).
- False negative: The value should be extracted(gold≠empty) but was not extracted by the model(result=empty).
- False positive. False negative: One value should have been extracted, but the model extracted another(wrong) one. It consists of two parts:
- The model did not extract a correct value where the correct value was available; the machine missed the correct value - FN.
- The model extracted the value, but the value was incorrect - FP.
Lets take a look at the example below:
Field name | Gold | Extracted | Decision |
invoice_sender | John Smith | John Smith | True positive |
invoice_sender | John Smith | False negative | |
invoice_sender | John Smith | Name:John Smith | False positive. False negative |
invoice_sender | John Smith | False positive | |
invoice_sender | True negative |
A slight difference exists between estimating classification results and information extraction results. There is no difference between the number of classified objects and the total number of objects in classification. For an information extraction task, think about processing 1.000 documents, and only 500 of them contain gold value. Assume your model extracted 400 results. Accordingly, the result is: the number of documents ≠ the number of gold values ≠ the number of extracted values.
Information Extraction metrics
Precision
Calculate Precision to find out if the values extracted from the model are accurate:
- Precision = Correctly extracted ÷ Extracted, or
- Precision = TP ÷ ( TP + FP + FP/FN)
Recall
Calculate Recall to find out the percent of the existing values that can be extracted by the model:
- Recall = Correctly extracted / Gold values, or
- Recall = TP ÷ (TP + FN + FP/FN)
Accuracy
Calculate Accuracy to find out the percentage of correct predictions our model makes:
- Accuracy = Correctly extracted ÷ Total number of predictions, or
- Accuracy = (TP + TN) ÷ (TP + TN + FP + FN + FP/FN)
Possible reasons of mistakes
FP | ||
Possible Reason | Solution | Notes |
Incorrect grouping for multi-value fields | Implement correct grouping in post-processing | Data set should be prepared very attentively in accordance with defined tagging rules and instructions. |
Missing values in the test set | Correct gold data, and tag/re-tag all the existing values that were missed or wrongly tagged, or exclude such records from test set | |
Mistakes in the test set, totally incorrect values are tagged | ||
FP-FN | ||
Insufficient normalization (extra symbols, different data types) | Normalize values in post-processing | |
Inconsistent gold data, variations in the values boundaries (e.g., invoice_number field has gold value “xxxxx” and extracted value “xxxxx HAB” — both are correct from business point of view, but are not equal and cannot be compared to each other) | 1. Correct all inconsistencies in the gold data:
2. If previous steps were applied, re-train the model 3. If gold data wasn't corrected, try to normalize values in post-processing | This kind of mistake shows that the data set wasn’t prepared properly. Make sure the training set contains only the documents in accordance with tagging instructions |
Cases of incomplete tagging in the training set | ||
OCR errors in extracted values | 1. Analyze whether there is any logic that allows correcting these mistakes without generating other mistakes on the whole data set and possible unseen data. If yes, implement corresponding post-processing 2. If a rule can cover only part of cases without creating extra FPs, try to define the remaining part to remove these values so they will be handled manually | |
Specific or broken document structure after OCR that makes it impossible to tag the value completely | Check whether any logic can be applied to extract the value completely in post-processing without creating additional FPs. If yes, such post-processing should be applied. | |
FN | ||
Not enough examples in the training set a. Small overall number of examples of some field(s) in the training set b. Small number of examples of the field in specific document structures | Increase the number of examples in the training set, and/or retrain the model | Should be identified and communicated in advance! |
Tagging inconsistency in the training set, the field is tagged in different positions | Correct/exclude inconsistencies for the field in the training set and retrain the model | This kind of mistake shows that data set wasn’t prepared properly. |
New document structure after OCR within known layout (a case of bad representation): | 1. If the case is valid, raise in advance that it is badly represented 2. If the case is invalid, estimate the impact of such documents | It is important to have enough documents of some specific structures, where this field is given in a way that's not very simple for extraction |
Model report analysis
Information Extraction
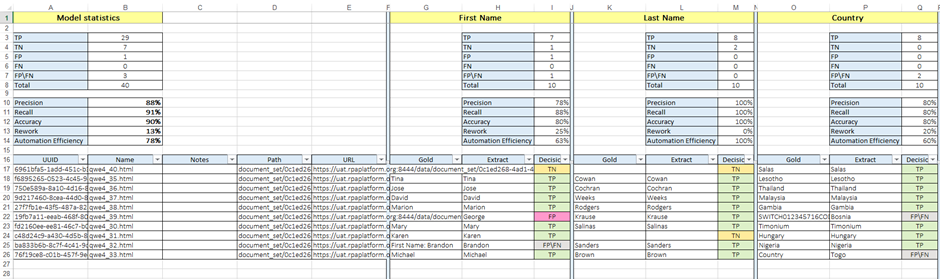
Easy RPA provides detailed Information Extraction model report that comes in two parts: Field Focused Report and Field Values Analysis Report. Please, refer to Generate Model Report in order to learn how to download report.
- Field Focused Report contains following calculated information about overall fields statistics (model statistics), and statistics for every single specific field:
- Precision. For more details, please refer to Precision.
- Recall. For more details, please refer to Recall.
- Accuracy. For more details, please refer to Accuracy.
- Rework - reflects the amount of effort required from Person to correct Machine Errors. This metric is calculated as the ratio of the values that were extracted incorrectly (Precision mistakes or FP) to all the correct values that are present in the data set (Gold). Calculated as: Rework = (FP + FPFN) ÷ (TP+FN+FPFN)
- Automation Efficiency - indicates the total amount of work that was automated by Machine and could be calculated as the amount of useful work done by the Machine. Calculated as: Automation Efficiency = (TP - FP - FP/FN) ÷ ( TP + FN + FP/FN)
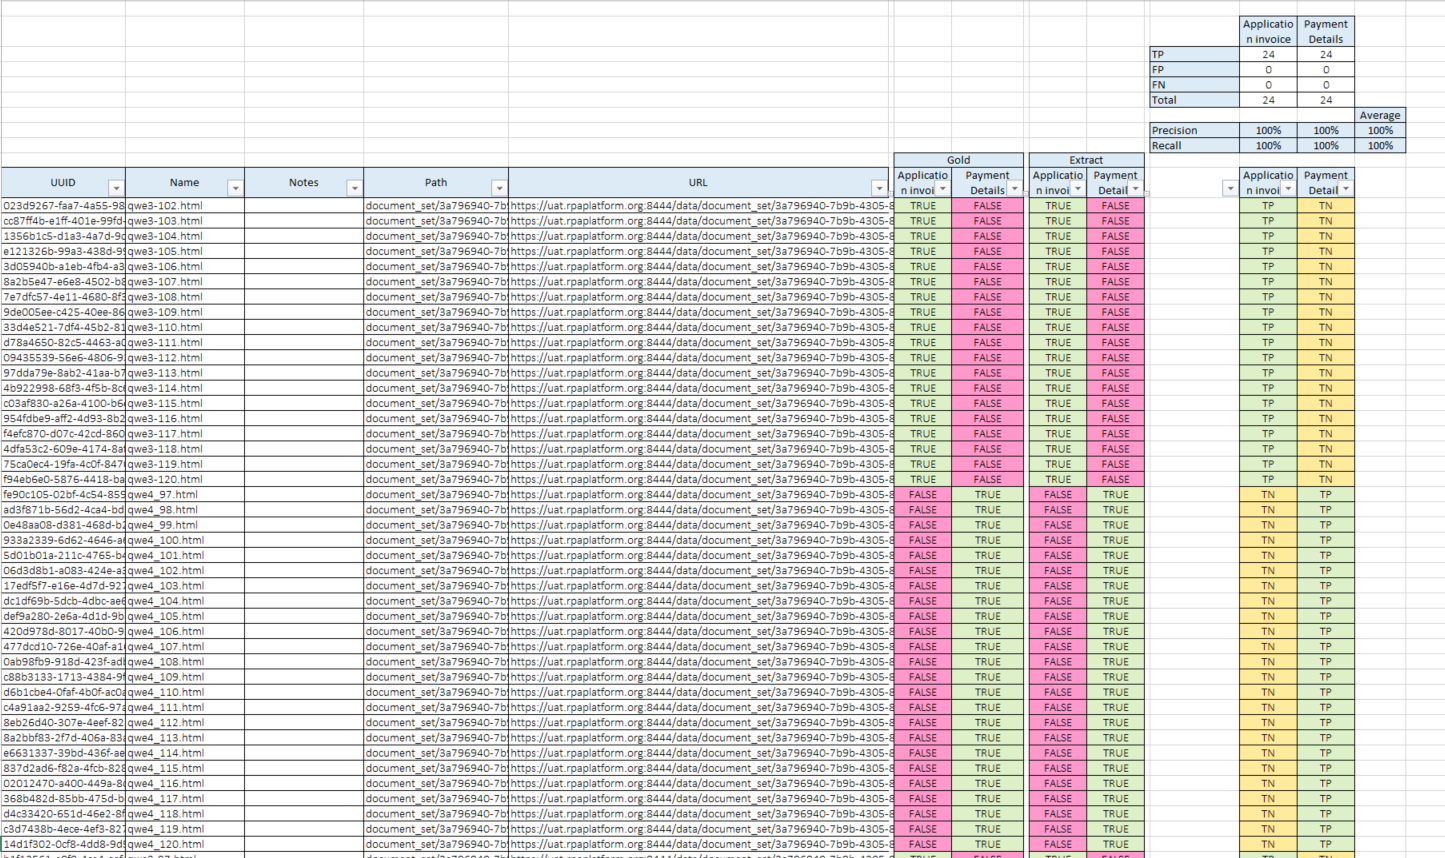
Document detailed information contains metadata and following information for specific field:
- Gold - field value extracted by SME during Human Task;
- Extract - field value extracted by the Model;
- Decision - type of mistake/correct result made by model.
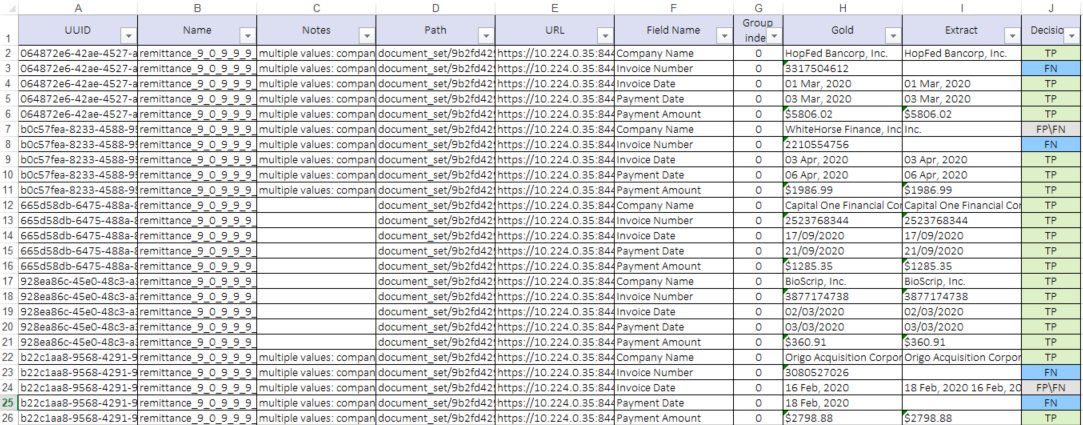
Field Values Analysis Report contains raw documents information and information on extracted fields.
Binary/Multiple classification
Easy RPA provides detailed Binary/Multiple classification model report. Please, refer to Generate Model Report in order to learn how to download report.
Classification results contains the following information:
- Precision. For more details, please refer to Precision.
- Recall. For more details, please refer to Recall.