Automation Process Run
Automation Process Run
The Runs page contains detailed information about a particular automation process run, its history, and event log which help users to monitor particular process execution. To view the list of the automation process runs, you need to be granted AutomationProcess-READ permissions. See Role Permissions.
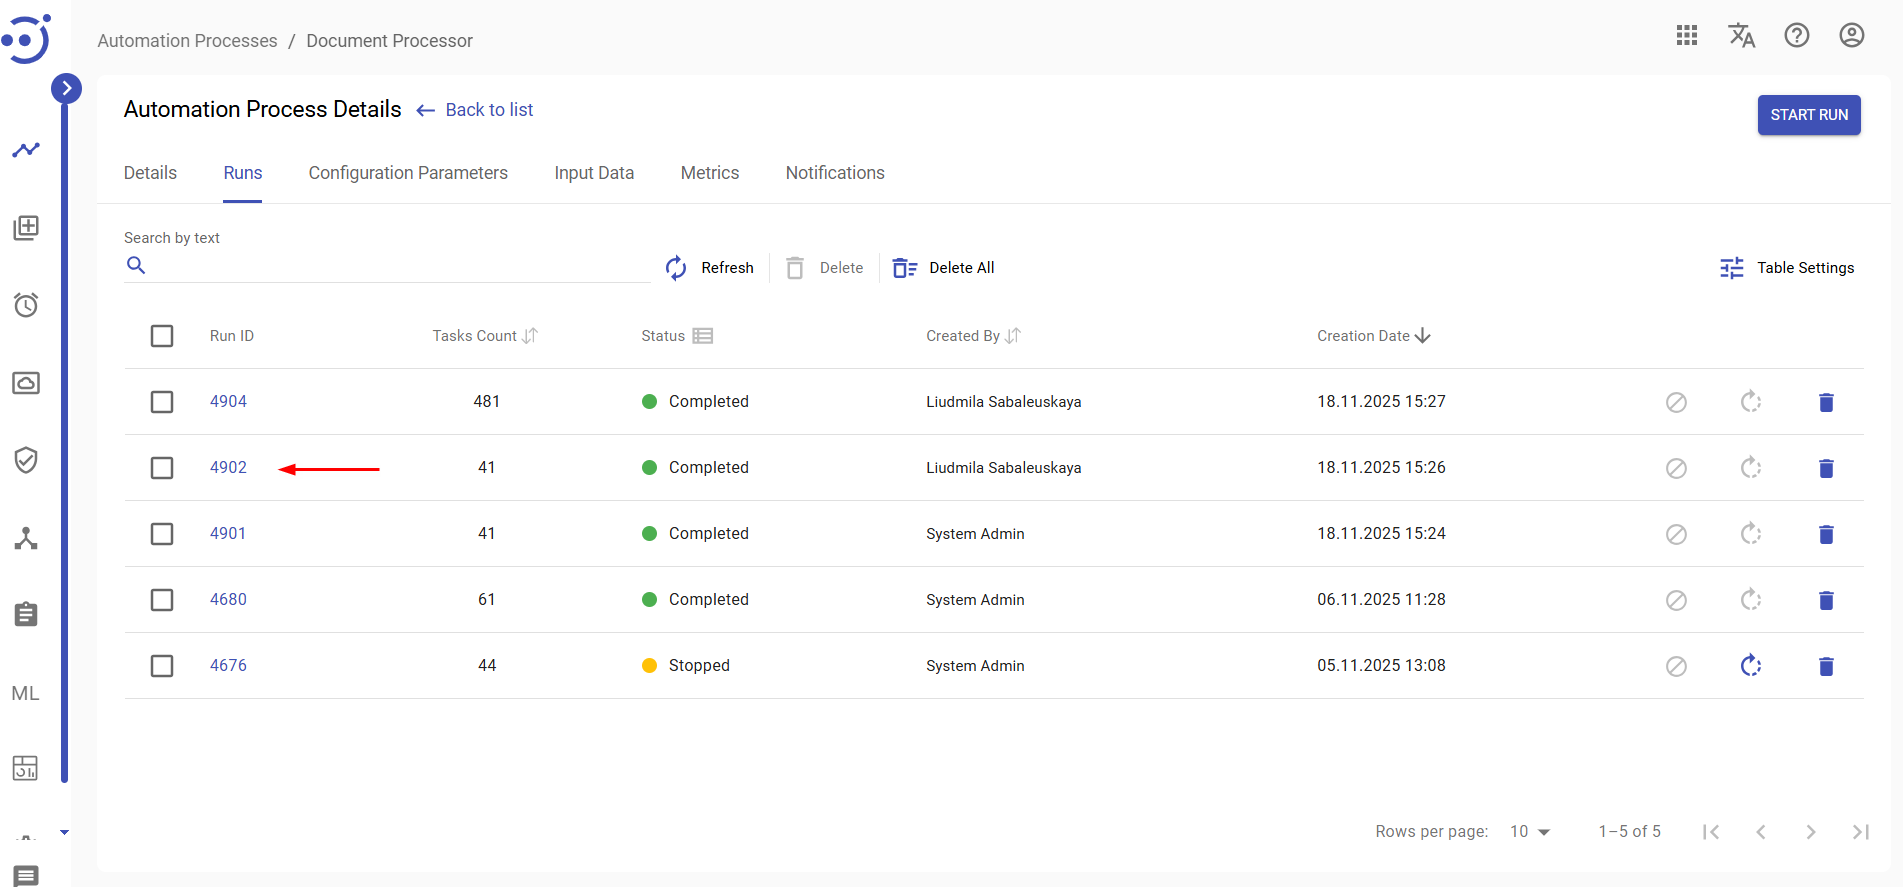
To navigate to the Run page, you need to:
- Navigate to the Automation Processes module.
- Click on the corresponding Automation Process Name.
- Click on the corresponding Automation Process Run ID. Required Permissions: AutomationProcess-READ.
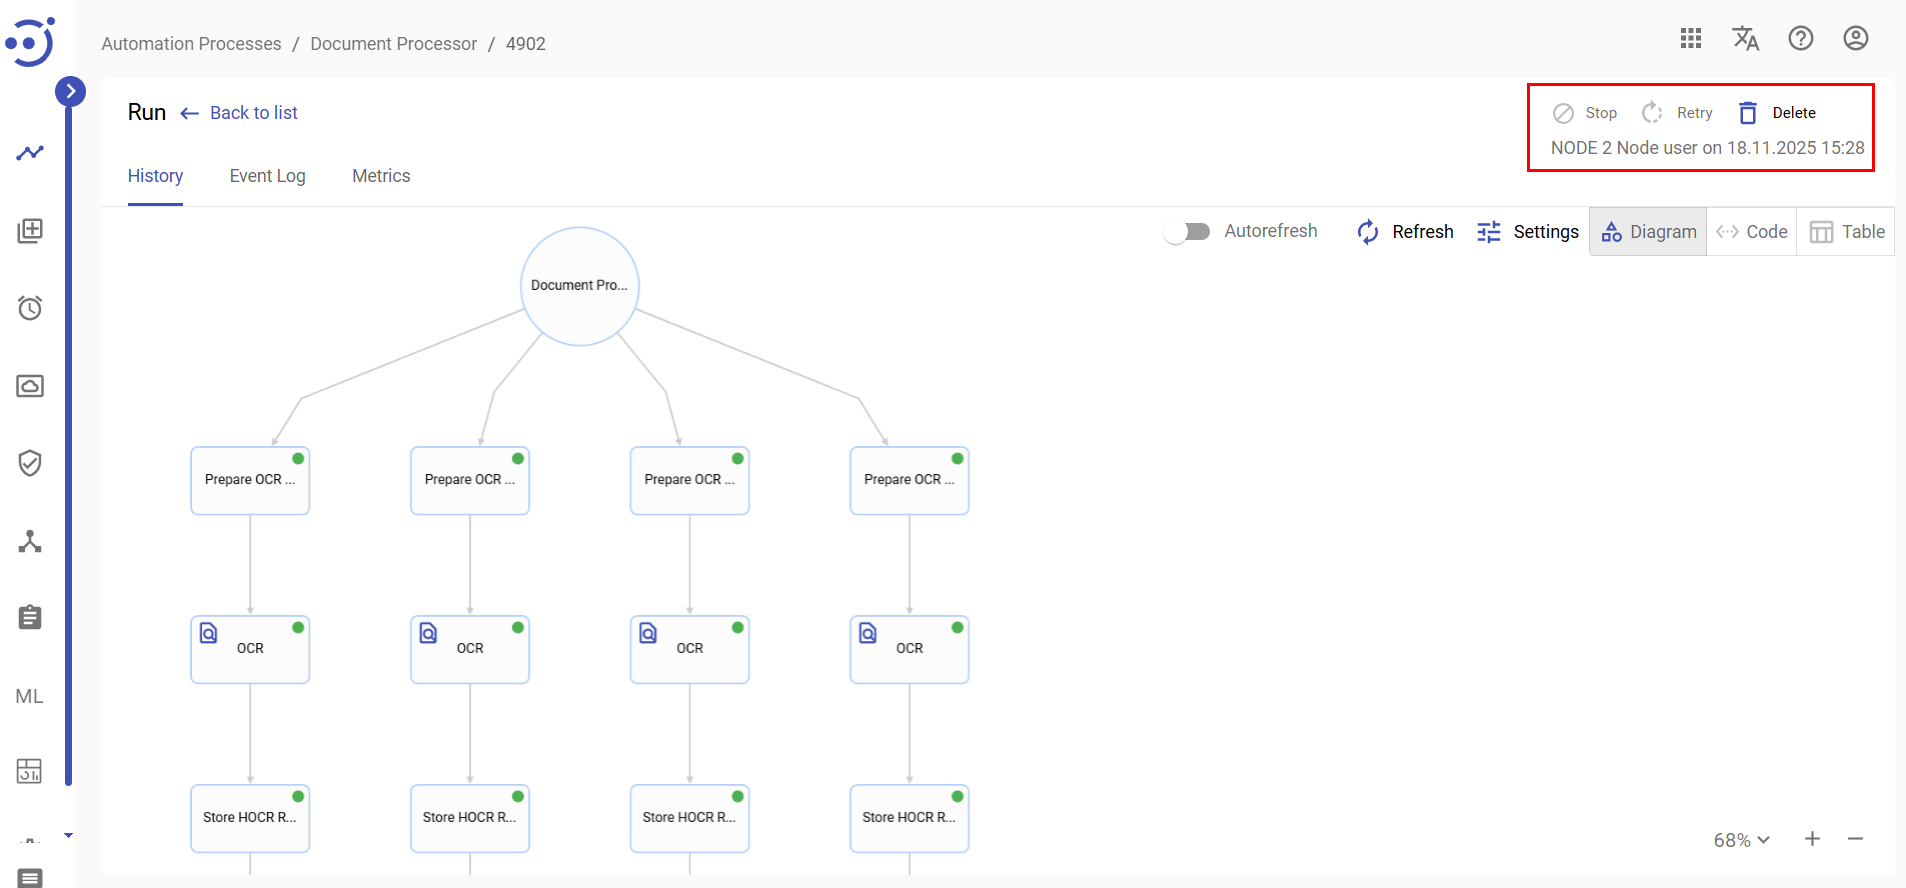
Each run has information about a user who started the Automation Process and start Date/Time and actions to Stop, Retry and Delete the automation process run (enabled for the corresponding Automation Process Run Status Lifecycle).
History
The History tab displays the automation process steps in either Diagram, Code or Table representation. To access the Automation Processes Run History, you need to be granted AutomationProcess-READ permission. See Role Permissions.
Control icons
- Stop - to stop the automation process run. Required Permission: AutomationProcess-ACTION.
- Retry - to repair the automation process run. Required Permission: AutomationProcess-ACTION.
- Delete - to delete the automation process run. Required Permission: AutomationProcess-UPDATE.
- Refresh - to pull the last process run state from the server.
- Diagram/Code/Table toggle - to switch between Diagram, Code or Table representation.
Diagram
The Diagram view shows the Task Tree with the Automation Process Module in the circle and the Automation Process Tasks in the subsequent rectangles.
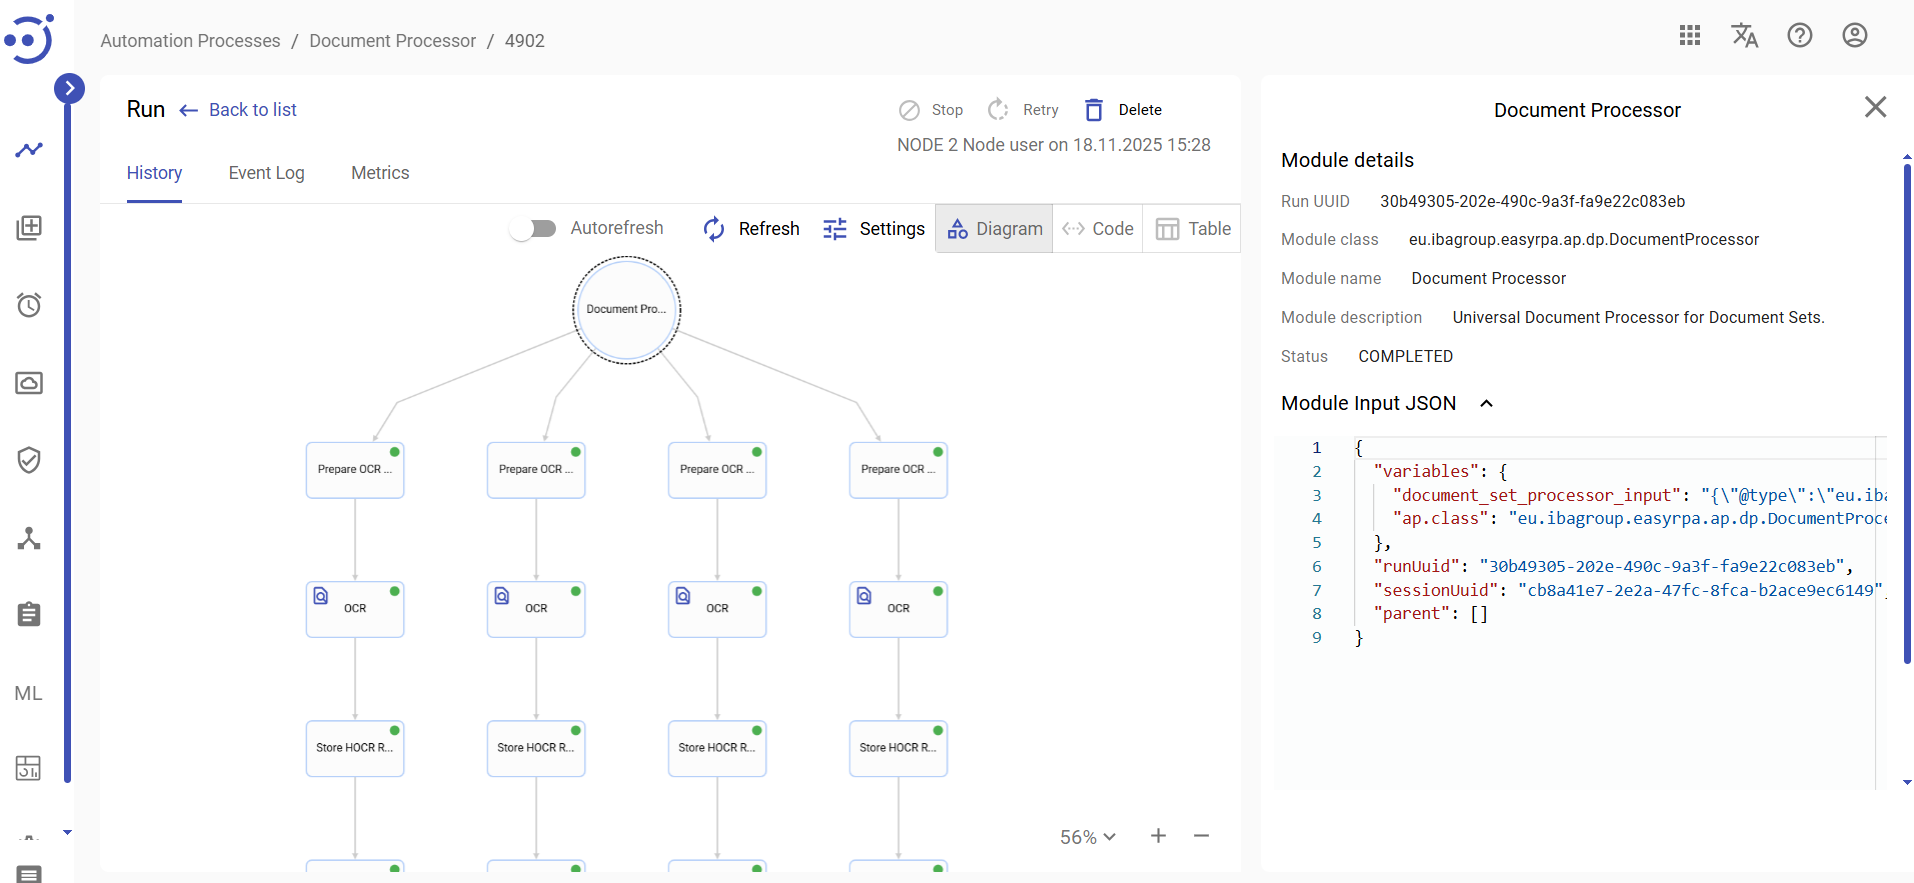
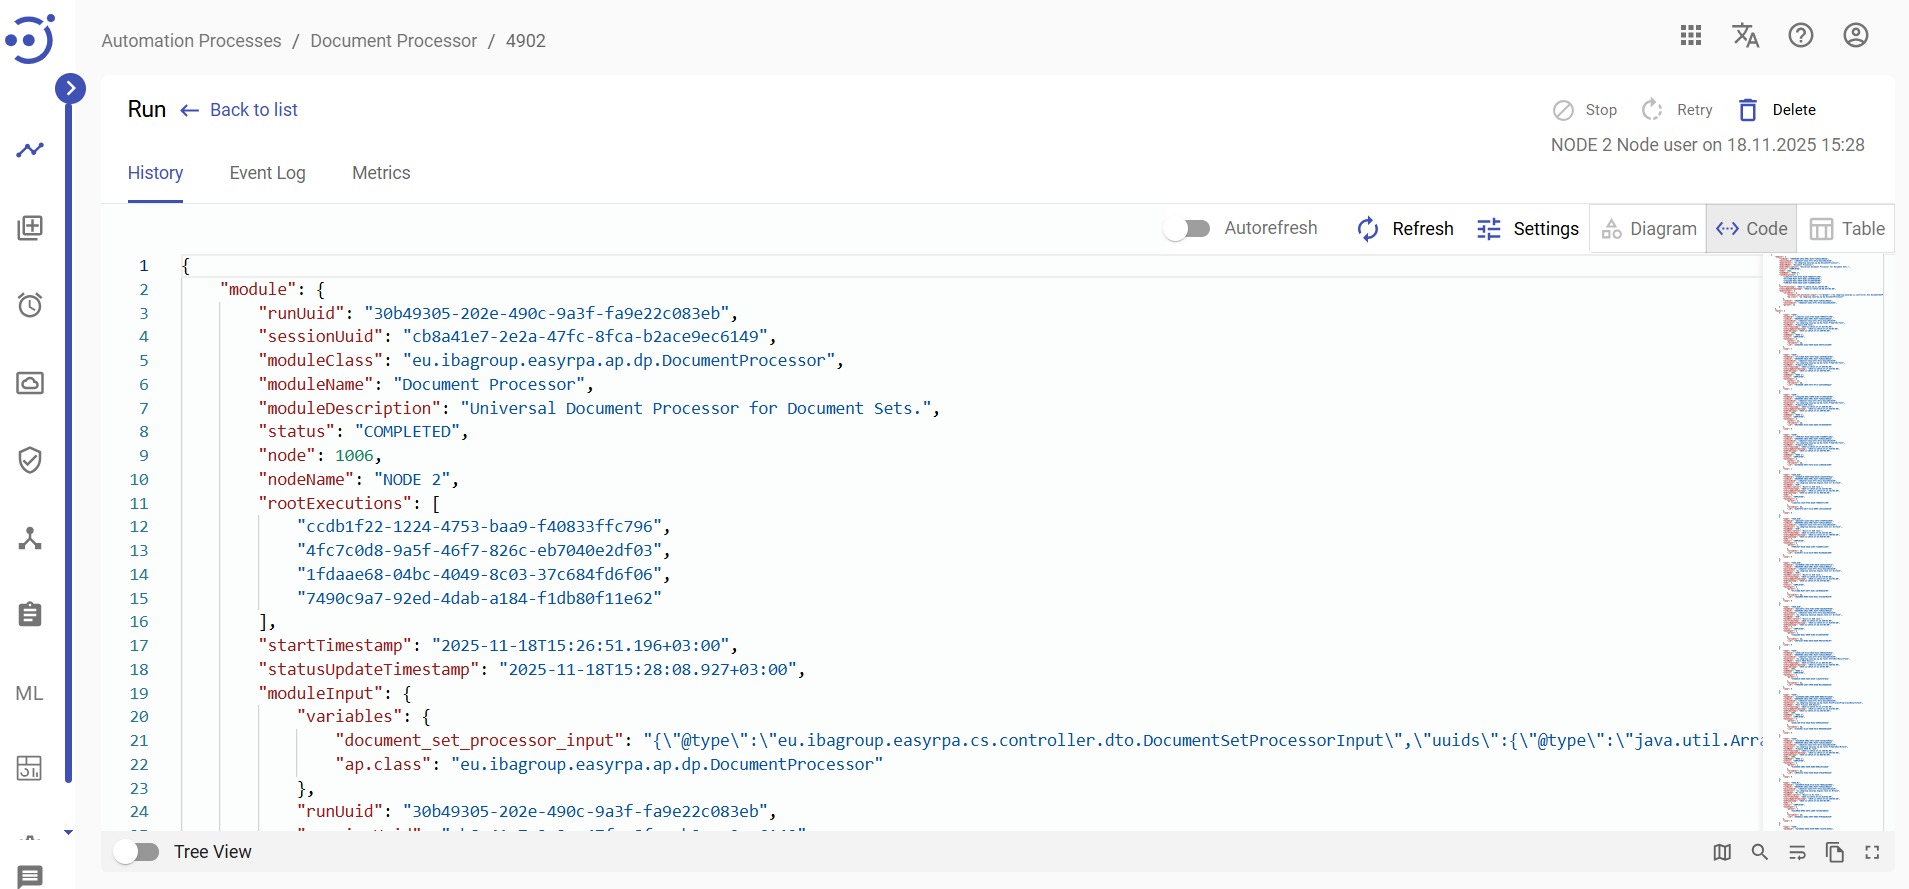
The first step describes the general information about the process run:
- Run uuid (example: c5d64b70-478a-427a-9168-7166470dd48e)
- Module class (example: eu.ibagroup.easyrpa.ap.iedp.DocumentProcessor)
- Module name (example: Document Processor)
- Module description
- Status (example: COMPLETED)
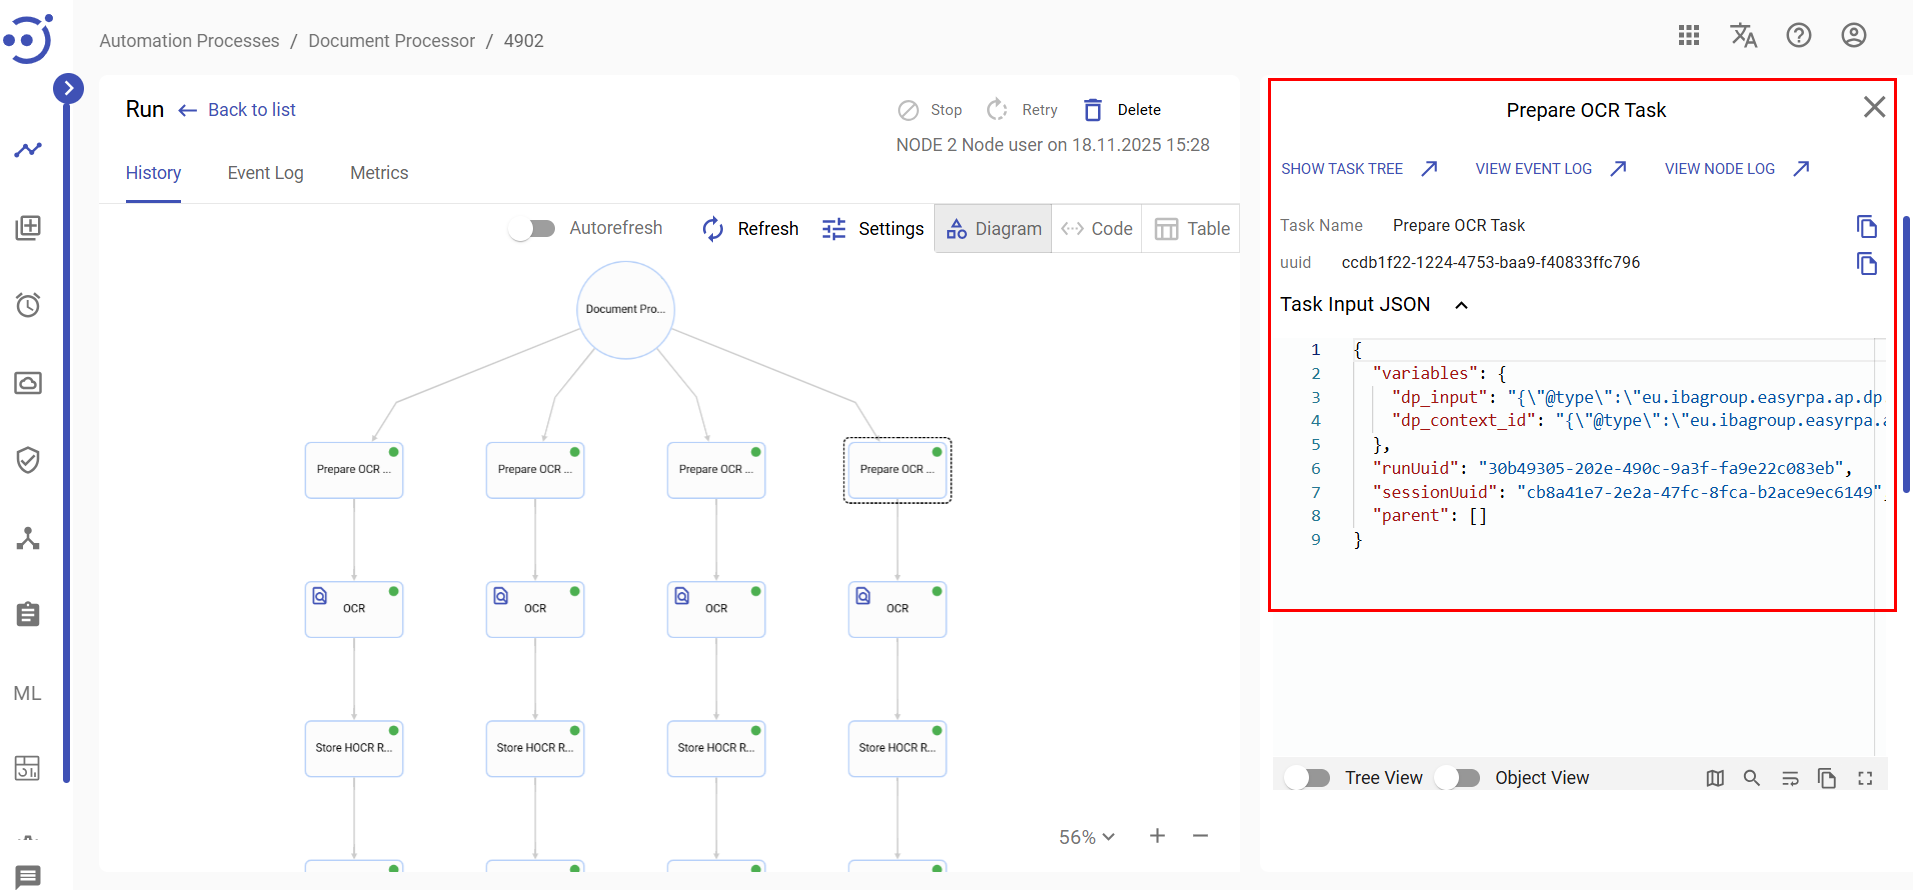
The subsequent steps describe every task executed by the bot with the Task Input & Output for each step in JSON format. It is possible to copy the data to the clipboard or expand it for easy viewing.
By clicking  icon, you can navigate to the particular Task Tree. Click
  icon to return to the initial screen.
You can also navigate to the Event Log of the selected task by clicking  icon, and to the Node Log of the node where a particular task was executed by clicking
  icon.
icon.
Control icons
- Refresh - to pull the last process run state from the server.
- Copy Task Name - to copy Task Name to the clipboard.
- Copy uuid - to copy Task uuid to the clipboard.
- Copy - to copy Task Input & Output to the clipboard.
- Enter Full Screen - to expand Task Input & Output in the full browser window.
- Exit Full Screen - to collapse the full browser window of Task Input & Output view.
Code
The Code view shows the Automation Process Tasks in the JSON representation.
Control icons
- Copy - to copy the process run JSON to the clipboard.
- Refresh - to pull the last process run state from the server.
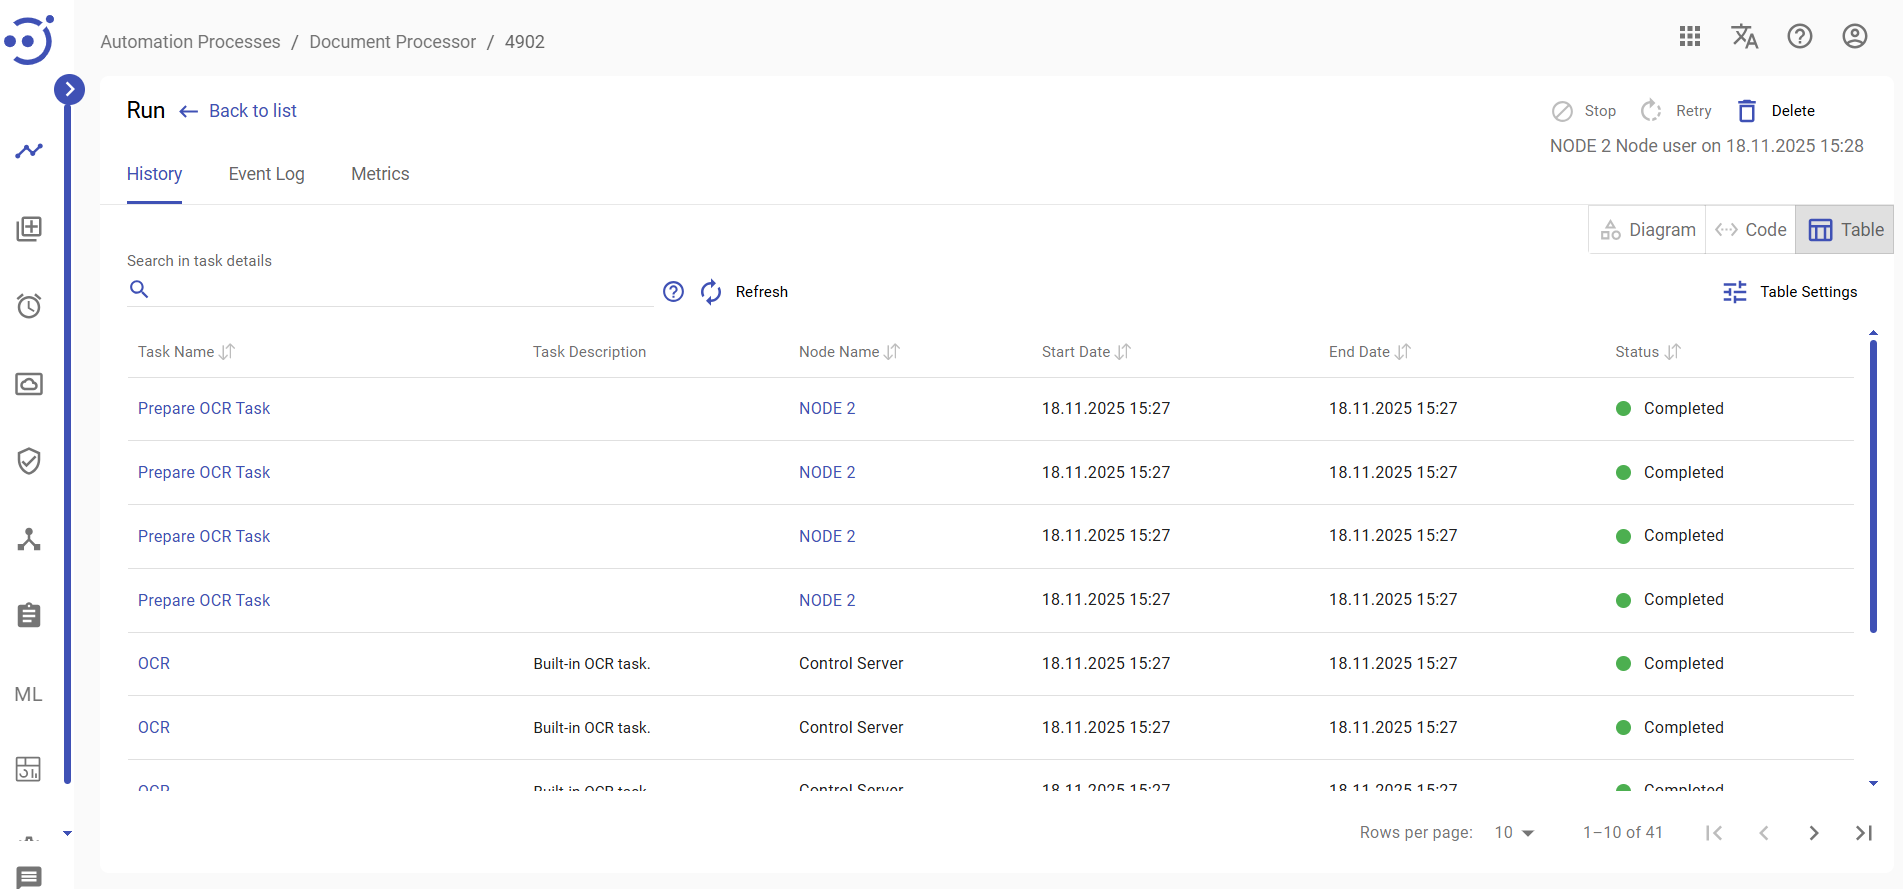
Table
The Table view displays the Tasks in the Table. It is possible to monitor on which Node the task was executed, its runtime period, and Status.
Search in task details
Search string allows searching by Task Input and Output JSON data. The search is case and diacritic insensitive. The rules are as follows:
Phrases
When matching on a phrase, as opposed to individual terms, enclose the phrase in escaped double quotes ("), as in:
| "a44fa4af-de9b-4868-949f-0ff820b6e0c7" |
If the search string includes both a phrase and individual terms, text search will only return entries that include the phrase.
For example, for the phrase "ssl certificate" :
| ""ssl certificate" authority key" |
Negations
A hyphen-minus (-) is used to negate a word:
- In the negated word search, entries with the negated word are not included in the search results.
- If you enter a search string that only contains negated words, text search will return no results.
- Words that contain a hyphen, such as "pre-market", are not negations. In hyphenated words, text operators treat the hyphen-minus (-) as a delimiter. The word "market" in this instance should be negated by placing a space between "pre" and "-market", i.e., pre-market.
The text operator adds all negations to a query with the logical AND operator.
Match Operation
- Stop words - the text operator ignores language-specific stop words, such as "
the"and "and"in English. - Stemmed Words - for case insensitive and diacritic insensitive text searches, the text operator matches on the complete stemmed word. If an entry contains the word "blueberry", a search for the term "blue" will not match it. However, the terms "blueberry" or "blueberries" will.
Table Settings
Table settings allow you to manage the table view. Click the icon ![]() to start working with the table settings. The table settings can be managed with the following buttons:
to start working with the table settings. The table settings can be managed with the following buttons:
- Advanced filter - to switch the advanced filters for the columns.
- Columns Display - to select the columns that will be displayed in the table.
- Apply - to apply the changes made to the table settings.
- Сancel - to cancel the last actions with the table settings.
Advanced filters by columns
Advanced Filter allows you to extract a list from a table with predefined criteria. Click the icon ![]() to start working with the advanced filter. The advanced filters can be managed with the following buttons:
to start working with the advanced filter. The advanced filters can be managed with the following buttons:
- Clear filter - to reset all the proposed advanced filter criteria for the column.
- Сancel - to cancel the last actions with the proposed criteria for the column.
Apply - to filter the table according to the proposed criteria for the column.
Control icon
Clicking Refresh icon allows to pull the last process run state from the server.
Event Log
The Event Log tab displays the logs of the particular automation process run. To access the Automation Processes Run Event Log, you need to be granted AutomationProcess-READ permission. See Role Permissions.
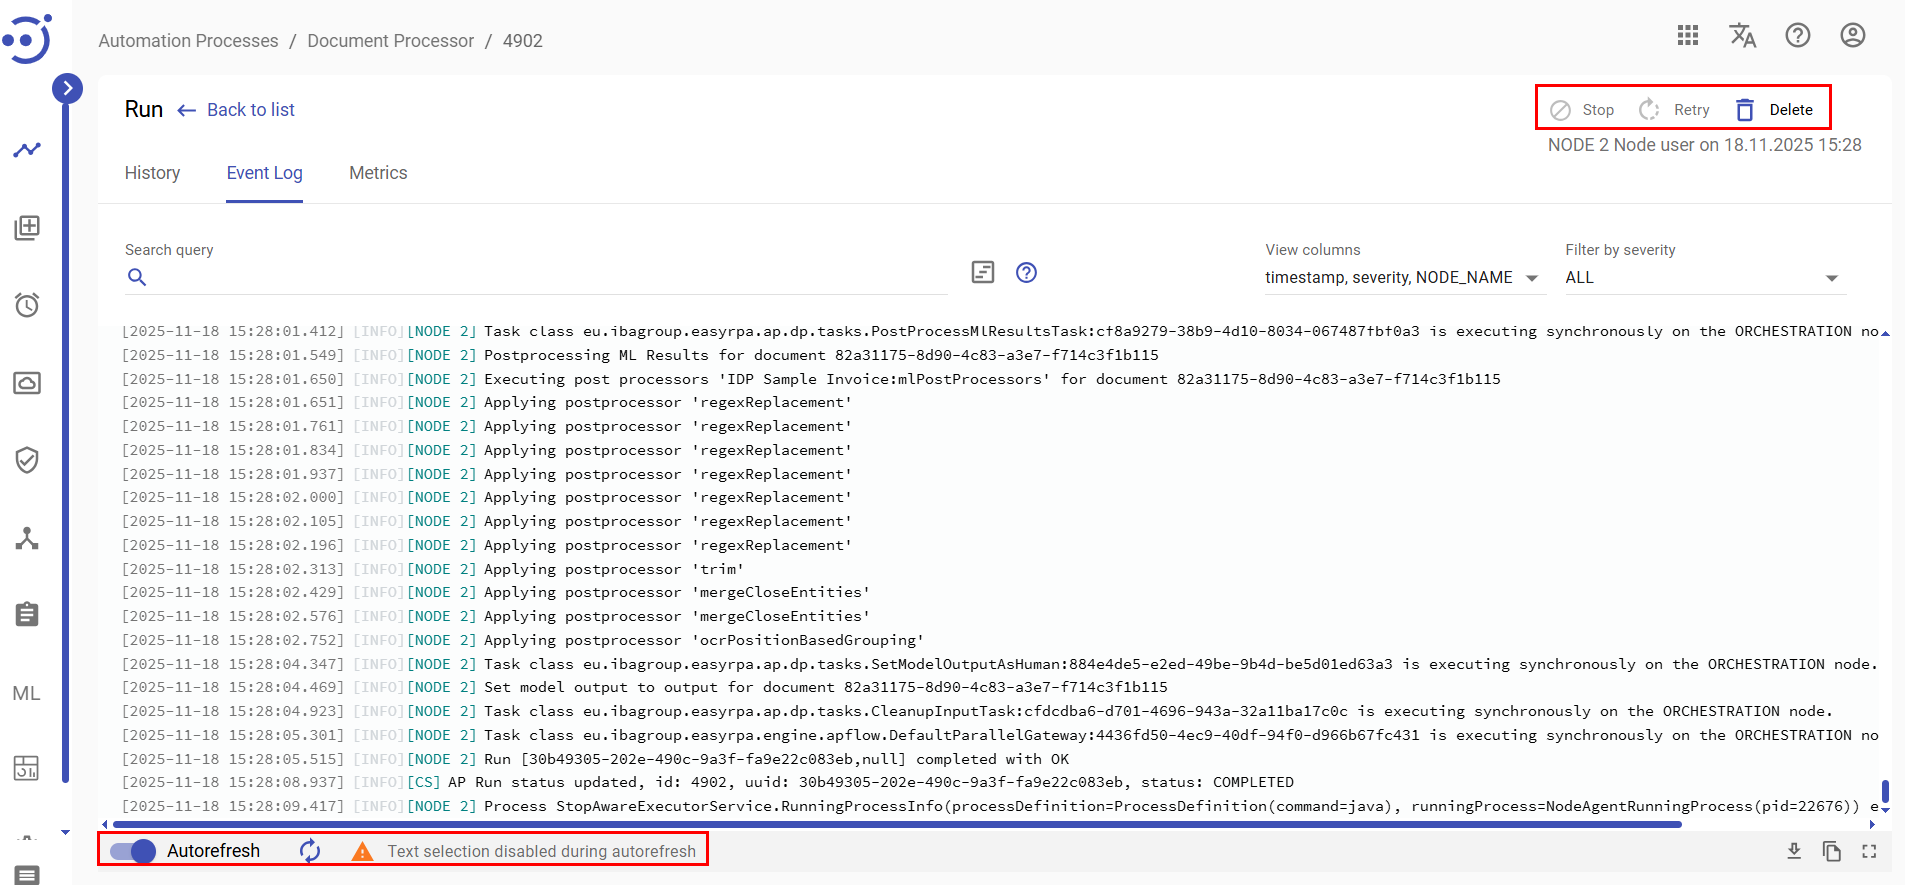
Control icons
- Stop - to stop the automation process run. Required Permission: AutomationProcess-ACTION.
- Retry - to repair the automation process run. Required Permission: AutomationProcess-ACTION.
- Delete - to delete the automation process run. Required Permission: AutomationProcess-UPDATE.
- Refresh - to pull the latest logs from the server.
- Autorefresh toggle - to turn on/off an automatic refresh of logs.
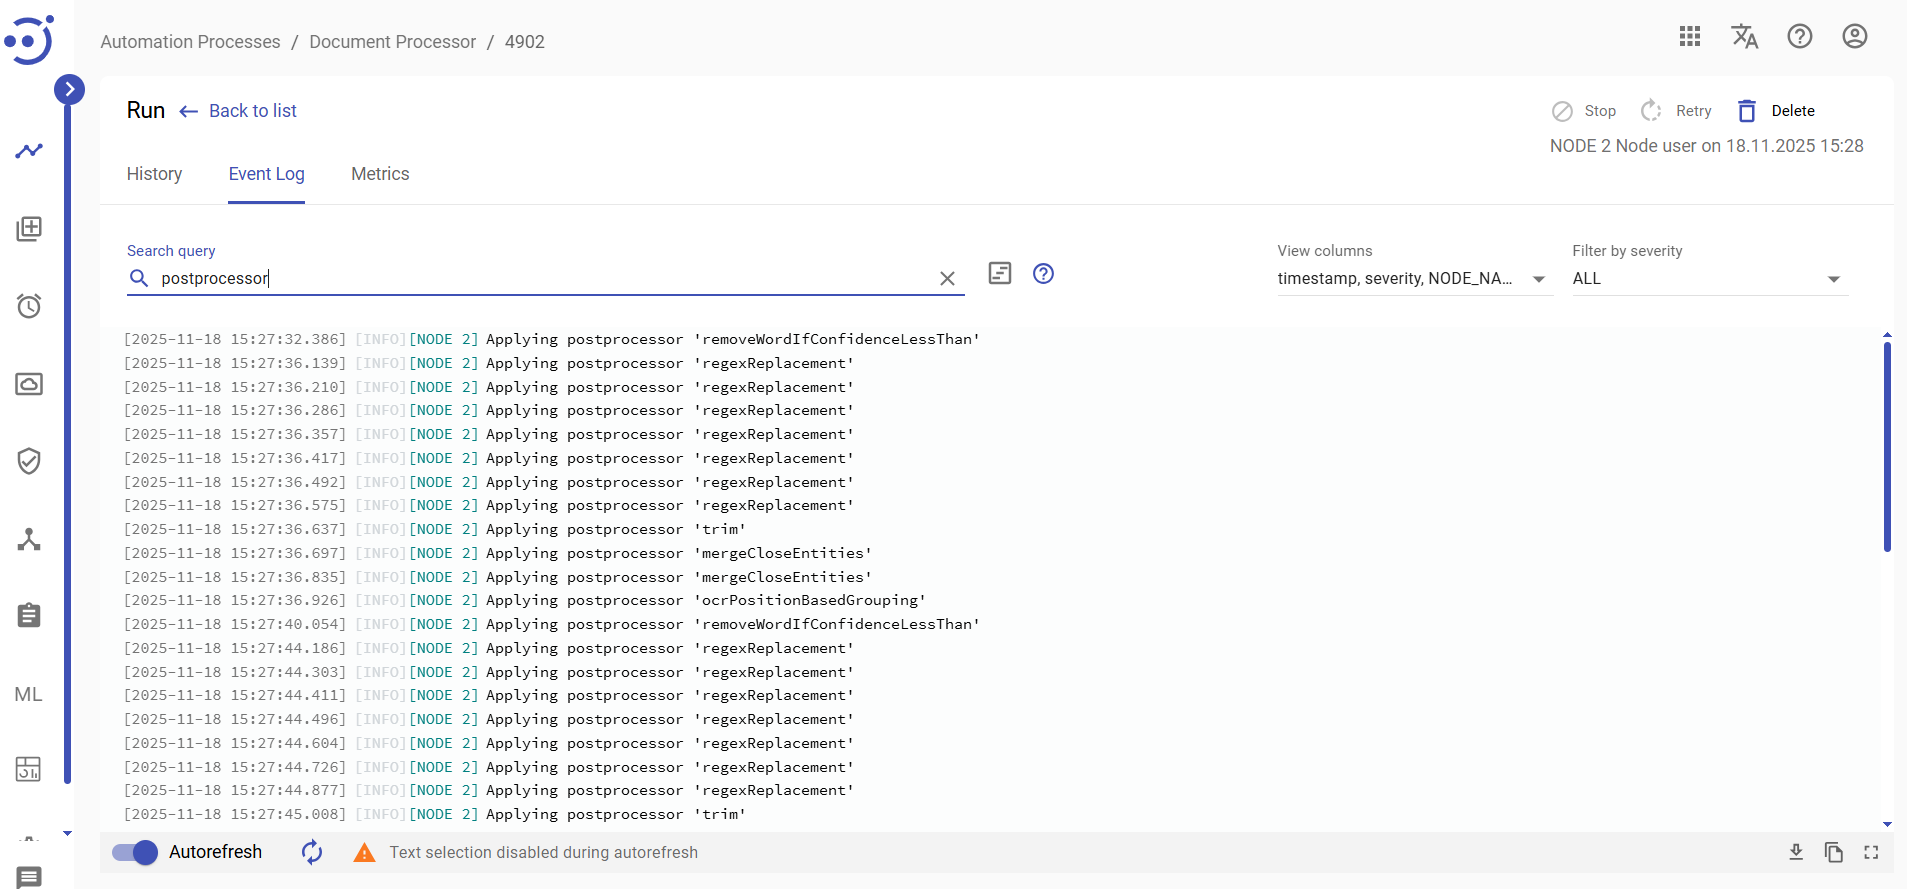
Search by text and Query search
You can search for a particular log by its text. The logs found are highlighted in yellow. Refer to the following article for more information on using the Search field to search through logs by query: Logs Search syntax.
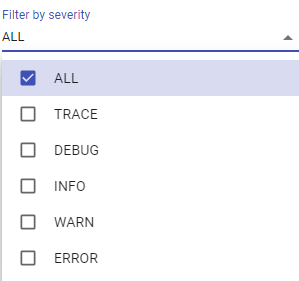
Filter by severity
Filtering allows you to choose the level of severity of the displayed logs from the dropdown menu. The available options are as follows:
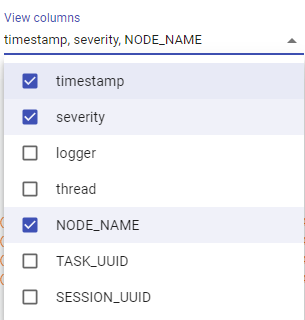
View columns
You can add or remove the columns timestamp/severity/logger/thread/NODE_NAME/TASK_UUID_SESSION_UUID from the event log view.
Not Full Logs
Not Full Logs indicator appears at the bottom right corner when the log becomes too long for one page: 
Full Screen
To view more log records simultaneously enter the full screen mode via clicking the corresponding button: ![]()
Copy
To copy the displayed logs only use Copy button: ![]()
Download Full Logs
To download full logs (a .txt file with logs) use Download Full Logs button: ![]()
Metrics
The Metrics tab allows users to view the graphs that visualize information about the Automation Process Run task statuses. To access the Metrics, you need to be granted AutomationProcess-READ permission. See Role Permissions.
Control icons
- Refresh - to refresh the metrics.
There are three graphs placed in the Metrics tab:
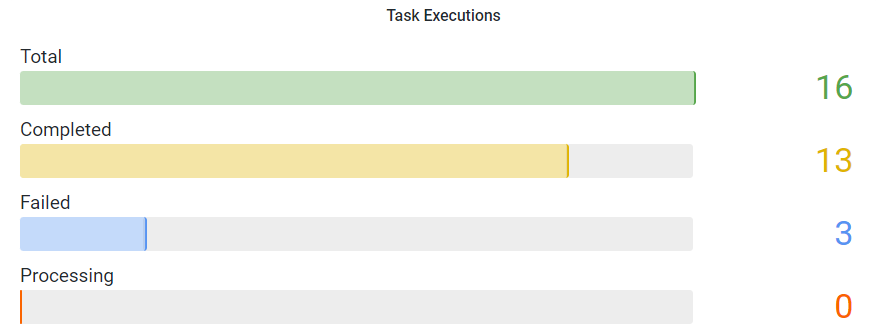
- Task Executions - the graph shows the number (abscissa axis) of task statuses (ordinate axis) that have been proceeded during the Automation Process Run. The graph shows the total number of task status transitions, as well as their breakdown by specific statuses, such as: Completed, Failed, Processing.
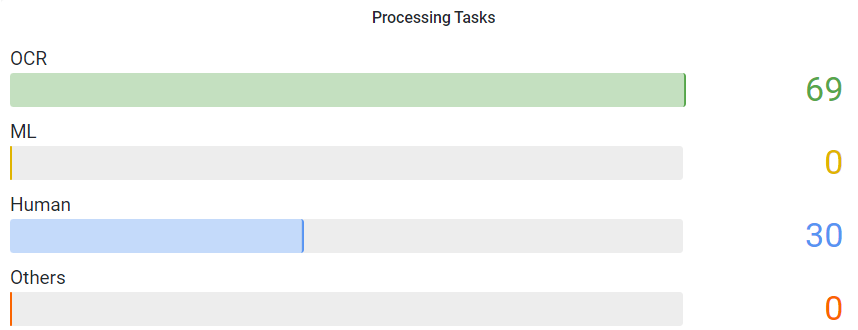
- Processing Tasks - the graph shows the number (abscissa axis) of the Automation Process Run Tasks currently being processed with a breakdown by task types (ordinate axis), such as OCR, ML, Human, Others.
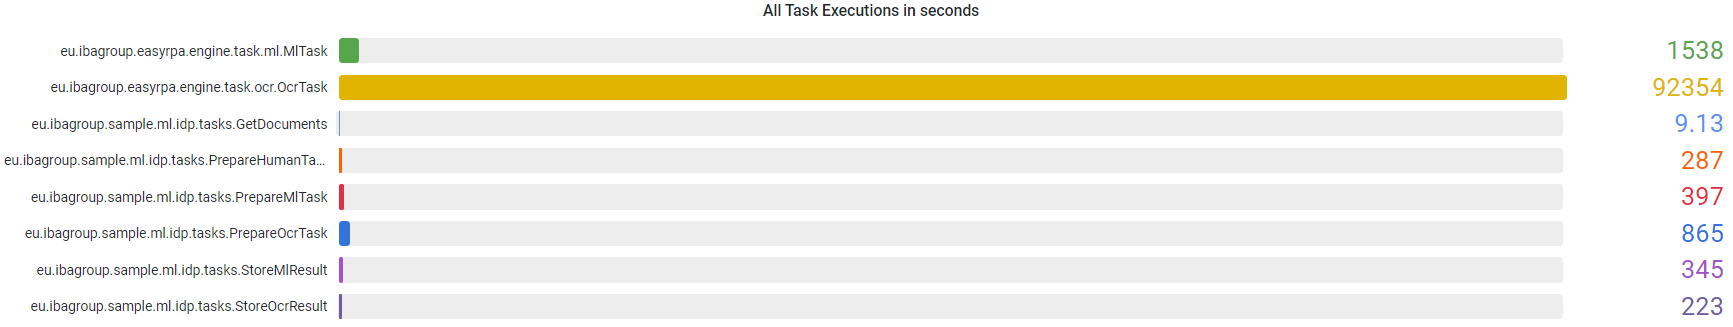
- All Task Execution in seconds - the graph shows the cumulated duration of the Automation Process Run Tasks with a breakdown by the task class name (ordinate axis).
Automation Process Run Status Lifecycle
The Automation Process Run can receive the following statuses:
- Submitted - transient status received after starting the automation process run, and before the automation process run is sent to the queue. (Might be displayed on the UI for milliseconds).
- Queued - received by the automation process immediately after clicking the "Start run", and is active until the necessary node is found. The 'Queued' status describes the state when the automation process gets queued on the Control Server side and is waiting for a free node (one in status Idle) on which it can be executed. The node is searched among not dedicated nodes on Control Server based on the capabilities described in Automation Process Details (Details tab).
- Deploying on Node - the automation process run receives the status when it finds the node required for its execution and is assigning to that node.
- In Progress - received when the automation process run is executed on the node.
- Stopping - transient status responsible for stopping the automation process run. The AP receives the status immediately after clicking the "Stop" icon.
- Stopped - the automation process run receives the status when its execution is stopped. It is possible to retry stopped automation processes.
- Stopped Idle - the automation process run receives the status when nothing happened with the tasks for some time. For example, Human tasks are in the Workspace without changes.
- Failed - describes the automation process run that is failed with an error. The details of the error can be found in the "Event Log" of the automation process run.
- Completed - indicates the successful completion of the automation process run.

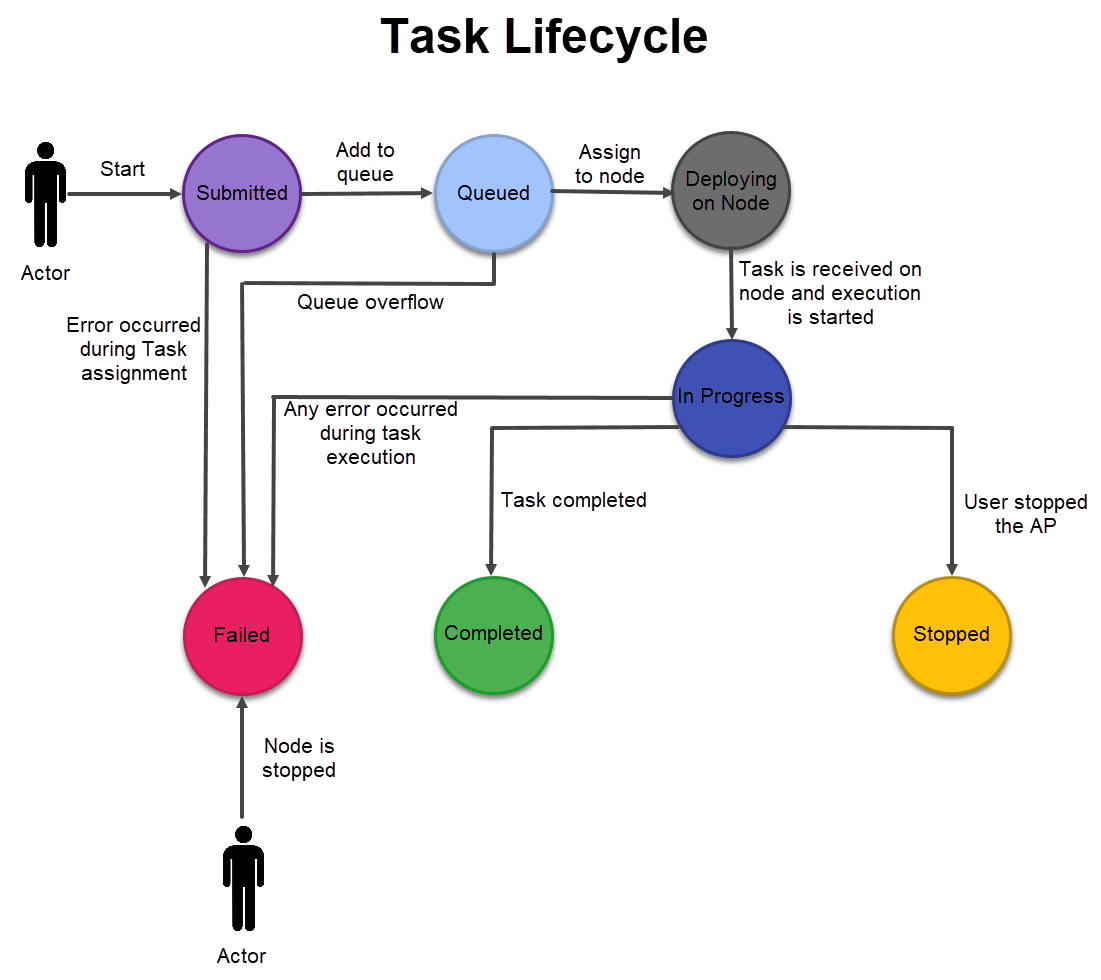
On the diagram below state transitions for the Automation Process and Task can be found:
- Automation Process
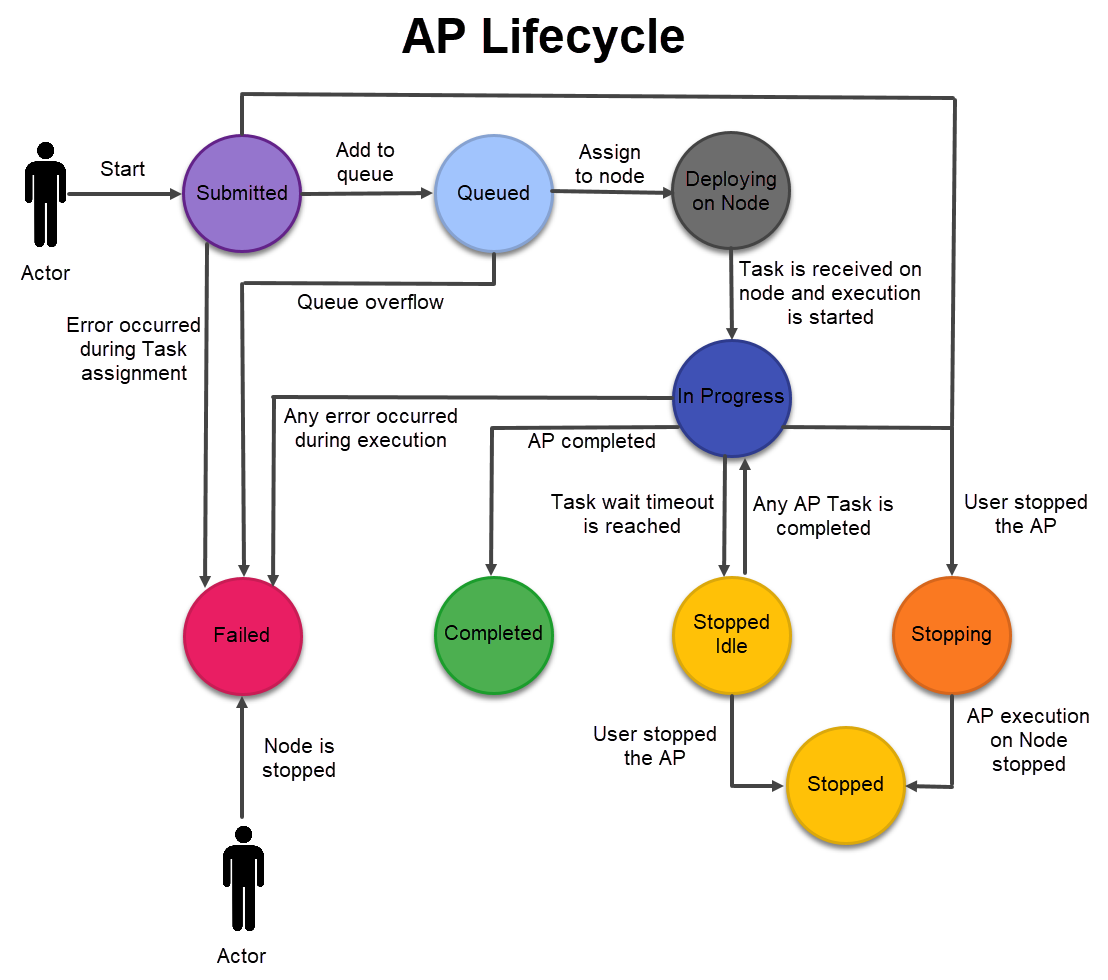
- Task
Control icons
The following actions can be applied to the automation processes with corresponding statuses:
Stop | Retry | Delete | |
|---|---|---|---|
| Submitted | ✗ | ✗ | ✓ |
| Queued | ✓ | ✗ | ✓ |
| Deploying on node | ✓ | ✗ | ✓ |
| In Progress | ✓ | ✗ | ✓ |
| Stopping | ✓ | ✗ | ✓ |
| Stopped | ✗ | ✓ | ✓ |
| Stopped Idle | ✓ | ✗ | ✓ |
| Failed | ✗ | ✓ | ✓ |
| Completed | ✗ | ✗ | ✓ |