Dashboard
Dashboard
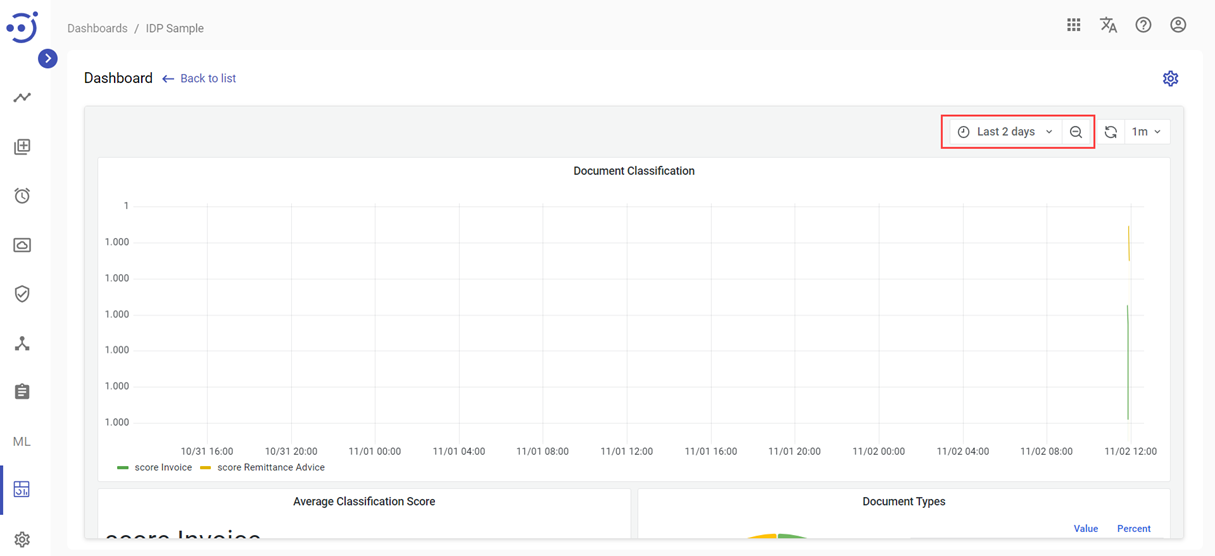
The Dashboard page contains developer-interpretable graph of business metrics that visualize information about the defined entities. To view the Dashboard page, you need to be granted Dashboard-READ permission. See Role Permissions.
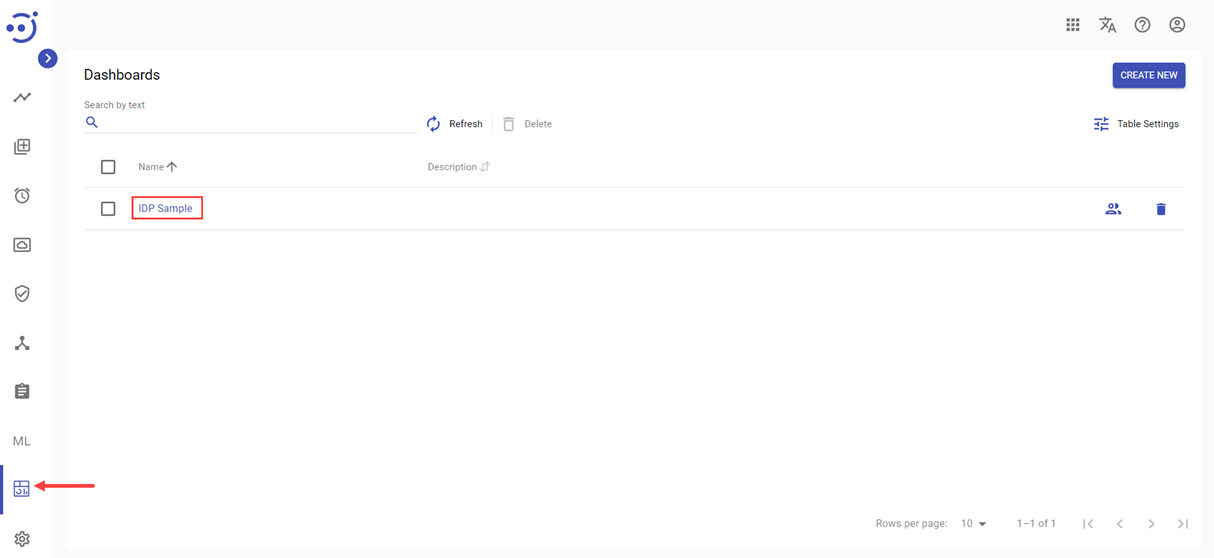
To access Dashboard, you need to:
- Navigate to the Dashboards page.
- Click on the corresponding Dashboard Name.
Control icons
- Refresh - to refresh the metrics.
To display the data on a graph within a particular time range drop-down Time range can be used.
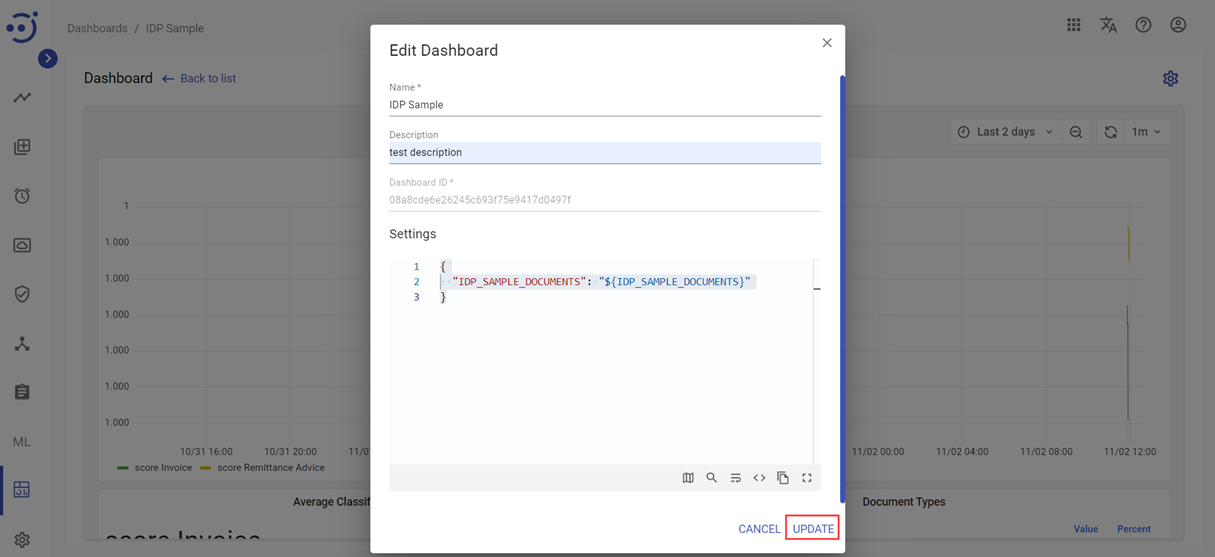
Edit Dashboard
To edit key information about an existing dashboard click on the ![]() icon. To access the Edit Dashboard window, you need to be granted Dashboard-READ permission for Dashboard context. See Role Permissions.
icon. To access the Edit Dashboard window, you need to be granted Dashboard-READ permission for Dashboard context. See Role Permissions.
You can edit the displayed fields and save the result by clicking the UPDATE button. Required Permission: Dashboard-UPDATE.
The pop-up window contains the following information:
- Name - the dashboard name.
- Description - a short description of the dashboard functionalities.
- Dashboard ID - dashboard identifier from Grafana.
- Settings - dashboard settings.