Log Management
Log Management
Introduction
EasyRPA provides logging infrastructure backed by logback java library.
In this section we explain how developer can make use of the logging system components to manage the logs effectively.
Defining Logger
All system events publish to a single logging facade which redirects them further in accordance with configuration.
To comply with the rest of the system a developer must define Slf4j logger and start logging to it.
import org.slf4j.Logger;
import org.slf4j.LoggerFactory;

class LocalRunner {
	private static final Logger log = LoggerFactory.getLogger(LocalRunner.class);

	public static void main(String[] args) {
		log.debug("This message will be logged");
		log.debug("This message includes arguments: {} and {}", "Europe", "Asia");
	}
}When running locally the above code ouputs to console:
![]()
Logging profiles
Depending of what configuration is using, there are different ways of configuring logging profiles:
- StandaloneConfigurationModule - there is no any restriction to use any logback configuration file, because no logs need to be stored on Control Server
- DevelopmentConfigurationModule - logs are stored on Control Server and loggback have to extend platform configuration
Configuring Logback with StandaloneConfigurationModule
In StandaloneConfiguration system uses logback-easyrpa-standalone.xml file for logback configuration. Here is a default one:
<!-- Logback configuration file for AP	-->
<configuration>
	<appender name="CONSOLE" class="ch.qos.logback.core.ConsoleAppender">
		<encoder>
			<pattern>%date{ISO8601} %-5level %logger{36} [%thread] [%X{RUN_UUID}] [%X{TASK_UUID}] - %msg%n</pattern>
		</encoder>
	</appender>
	<root level="${log.level:-INFO}">
		<appender-ref ref="CONSOLE" />
	</root>
	<logger name="eu.ibagroup" level="${log.level:-INFO}" additivity="false">
		<appender-ref ref="CONSOLE" />
	</logger>
</configuration>
To override the default one, put the file into your project resources.
Pattern
Default output pattern is configured as %d{HH:mm:ss.SSS} [%thread] %-5level %logger{36} - %msg%n
This can be translated as:
%d{HH:mm:ss.SSS}current date as HH:mm:ss.SSS[%thread]thread name enclosed in square brackets%-5levellog level (padded to five characters)%logger{36}logger name (36 character max)%msglogged message%nnew line special character
This is exactly what the logger showed in our example.
The output pattern as well as other logger settings can be changed in logback.xml file. This file is loaded from resource folder when java application is started.
There are two new features introduced in file besides already familiar pattern: appender and level.
Appender
Appender handles the event sent to logger.
CONSOLE appender (with accompanying class ch.qos.logback.core.ConsoleAppender) redirects our logs to standard output, the console it is.
Logback also allows other outputs such as FileAppender etc, you can read more about them in the official documentation.
Level
Level is what constitutes the hierarchy of events. This in turn allows to filter out the events by their severity.
To date logback provides five levels: ERROR, WARN, INFO, DEBUG, TRACE
Now consider an example:
log.trace("This is the trace message");When running this example the output shows nothing. This is because the precedence of trace level is lower than debug level configured in logback.xml
Let's change root level in logback.xml as following: <root level="DEBUG"> and rerun the example.
This time the output log is there:
![]()
Configuring Logback with DevelopmentConfigurationModule
In DevelopmentConfigurationModule all logs are stored in Control Server and changing platform logback configuration could bring logging problems, you can only add new loggers and change log levels.
Change log level threshold
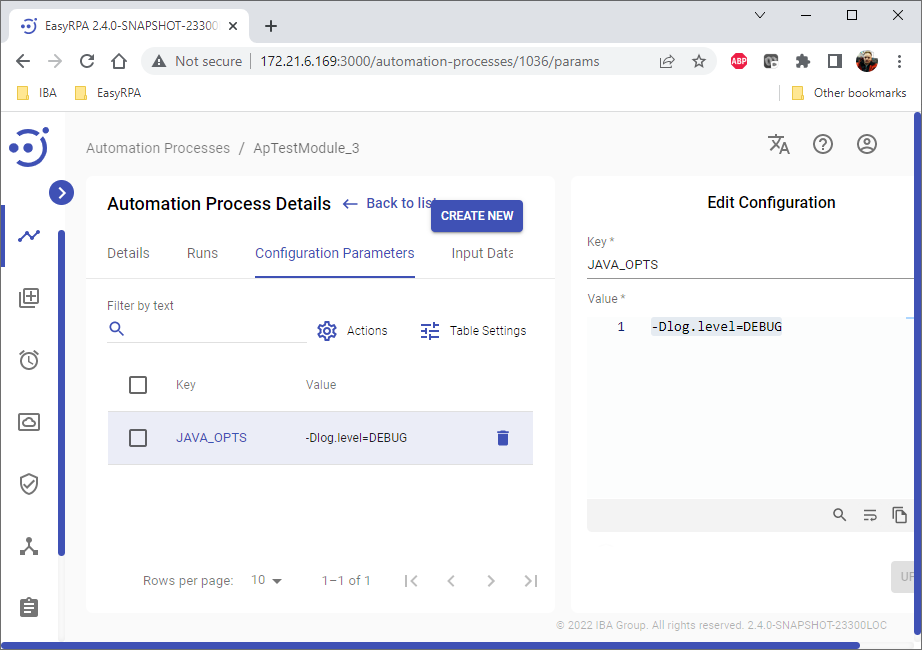
Default log level for ROOT logger is INFO. It means that only ERROR, WARN, INFO will be logged in console or Automation Process log. You can change the level by java system property into Automation Process:
-Dlog.level=DEBUG
In Control Server you need to add/update JAVA_OPTS CS/Node/Automation Process parameter:
Define Logger Levels
You can define logger level for every level. For this you need to add the a resource file into you Automation process project, use the following one as a template:
<?xml version="1.0" encoding="UTF-8"?>
<included>
	<logger name="org.apache.http" level="INFO" />
	<logger name="eu.ibagroup.easyrpa.tests" level="ALL" />
</included>
And add the defined configuration into the logback configuration by adding the following java system variable:
-Dlog.file=logback-ap.xml
In Control Server you need to add/update JAVA_OPTS CS/Node/Automation Process parameter:
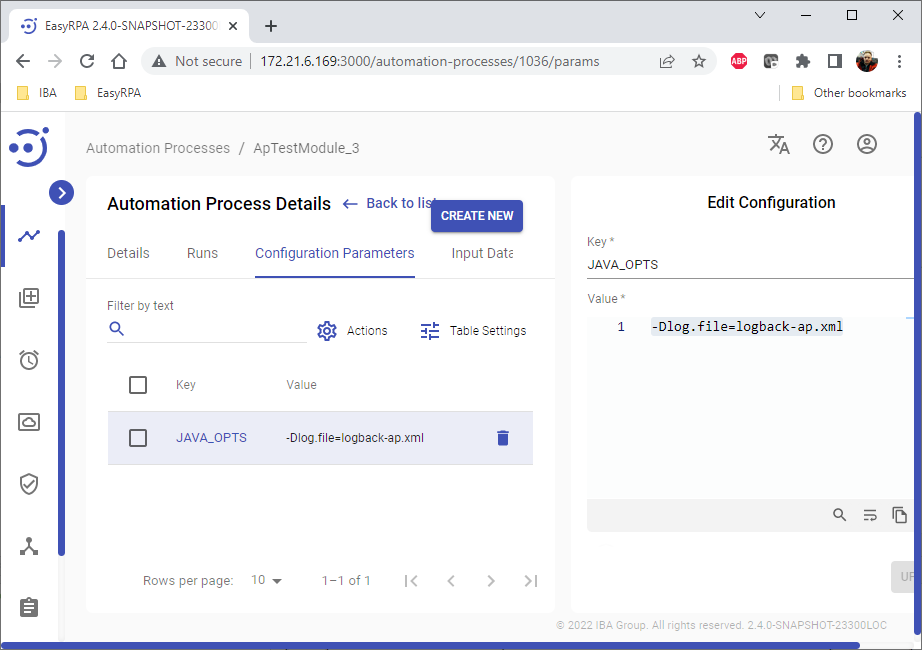
Where the log.file refers to the resource file from your jar.
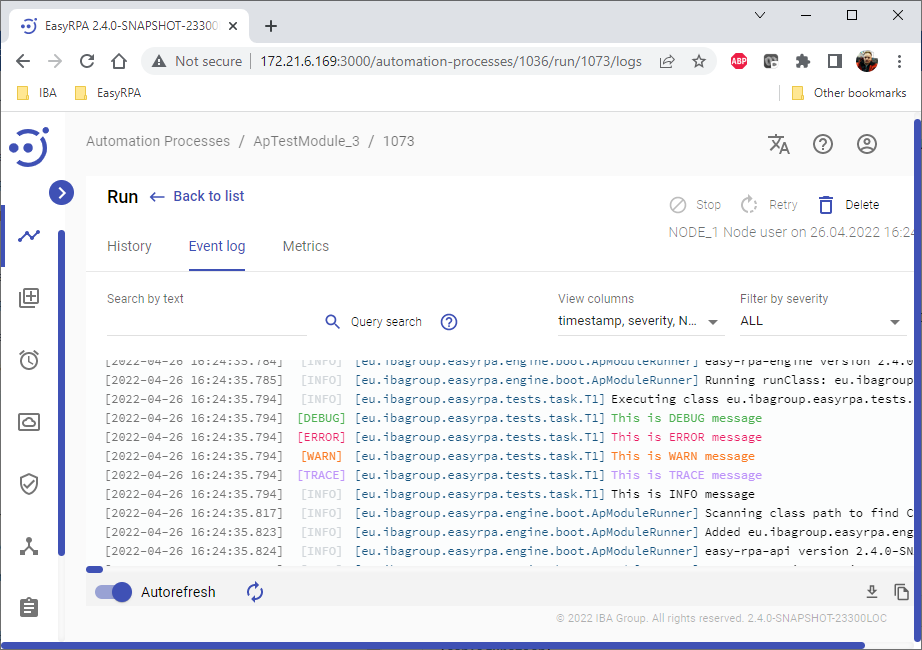
Retrieving CS Logs
Normally the developer works standalone - runs code in IDE and immediately sees the output in console, but in Control Server it's a bit different.
Control Server stores its logs in Elastic Search, the same does Node Agent which runs AP.
The easiest way to check AP logs is to open Event Log:
- go to Automation Processes list
- click on the AP name
- click on Run Id
- follow to the Event log tab