Debug AP on remote node without Control Server
Debug AP on remote node without Control Server
Sometimes RPA developer can start implementation earlier than EasyRPA Control Server and infrastructure are prepared. It's possible to run Automation Process on remote node. Node runs Automation Process as separate java process, so we can use standard Java debugging approach for this.
1. Build "uber" jar of the automation process project, for example using "shade" plugin:
![]()
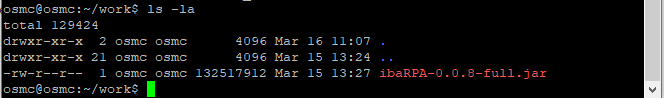
2. Upload the jar to remote machine. In the example below it was uploaded to Linux Node Agent using ssh:
3. Install JRE on the remote machine.
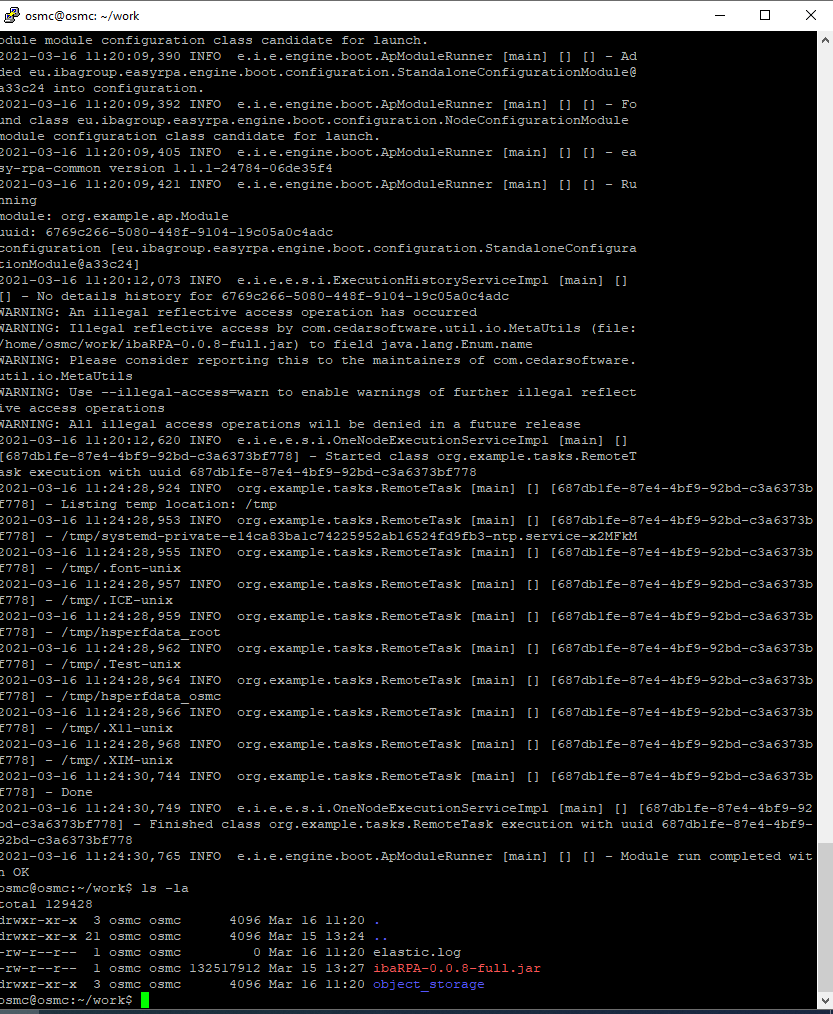
4. Launch the Automation Process jar as remote server specifying debug flag:
Command
java -jar -Xdebug -Xrunjdwp:transport=dt_socket,server=y,suspend=y,address=0.0.0.0:5005 ibaRPA-0.0.8-full.jar -m org.example.ap.Module
where "-m" - module to launch
As result, you should see message "Listening for transport dt_socket at address : 5005":

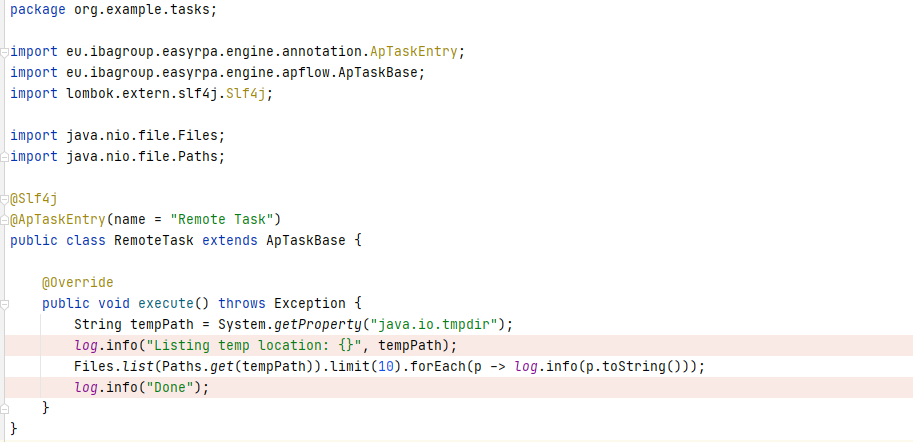
5. On local machine in Intellij IDEA add breakpoint in a Task:
6. Create new Run Configuration → Remote JVM Debug:
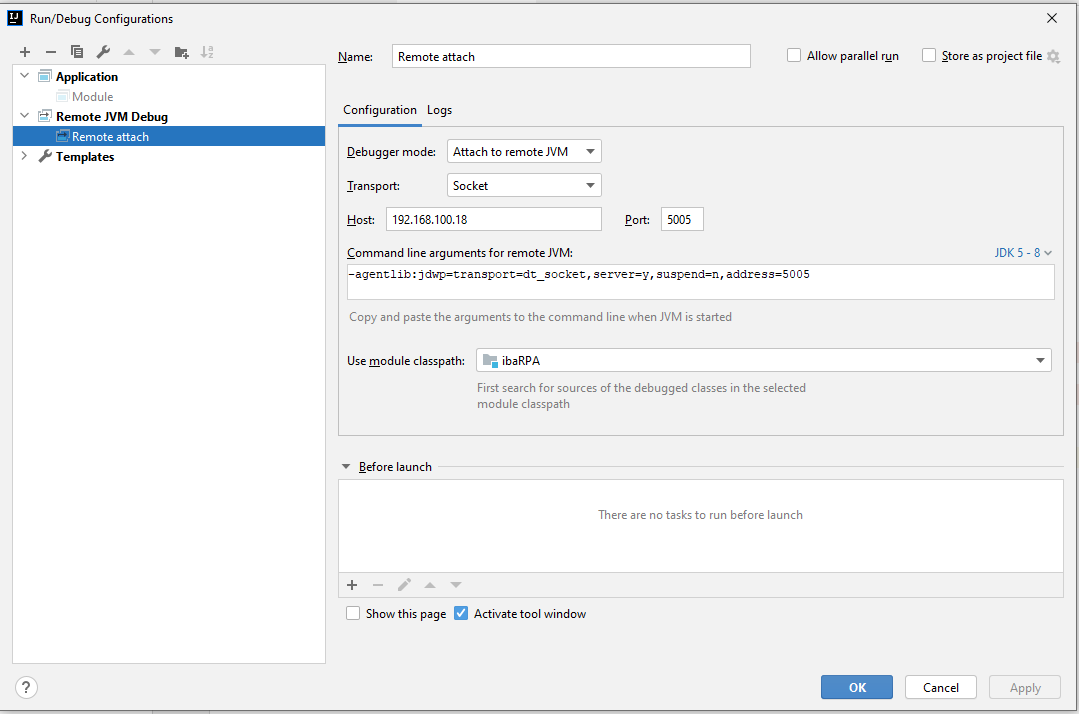
Select "Attach to remote JVM " option under "Debugger mode";
Specify Host address and Port.
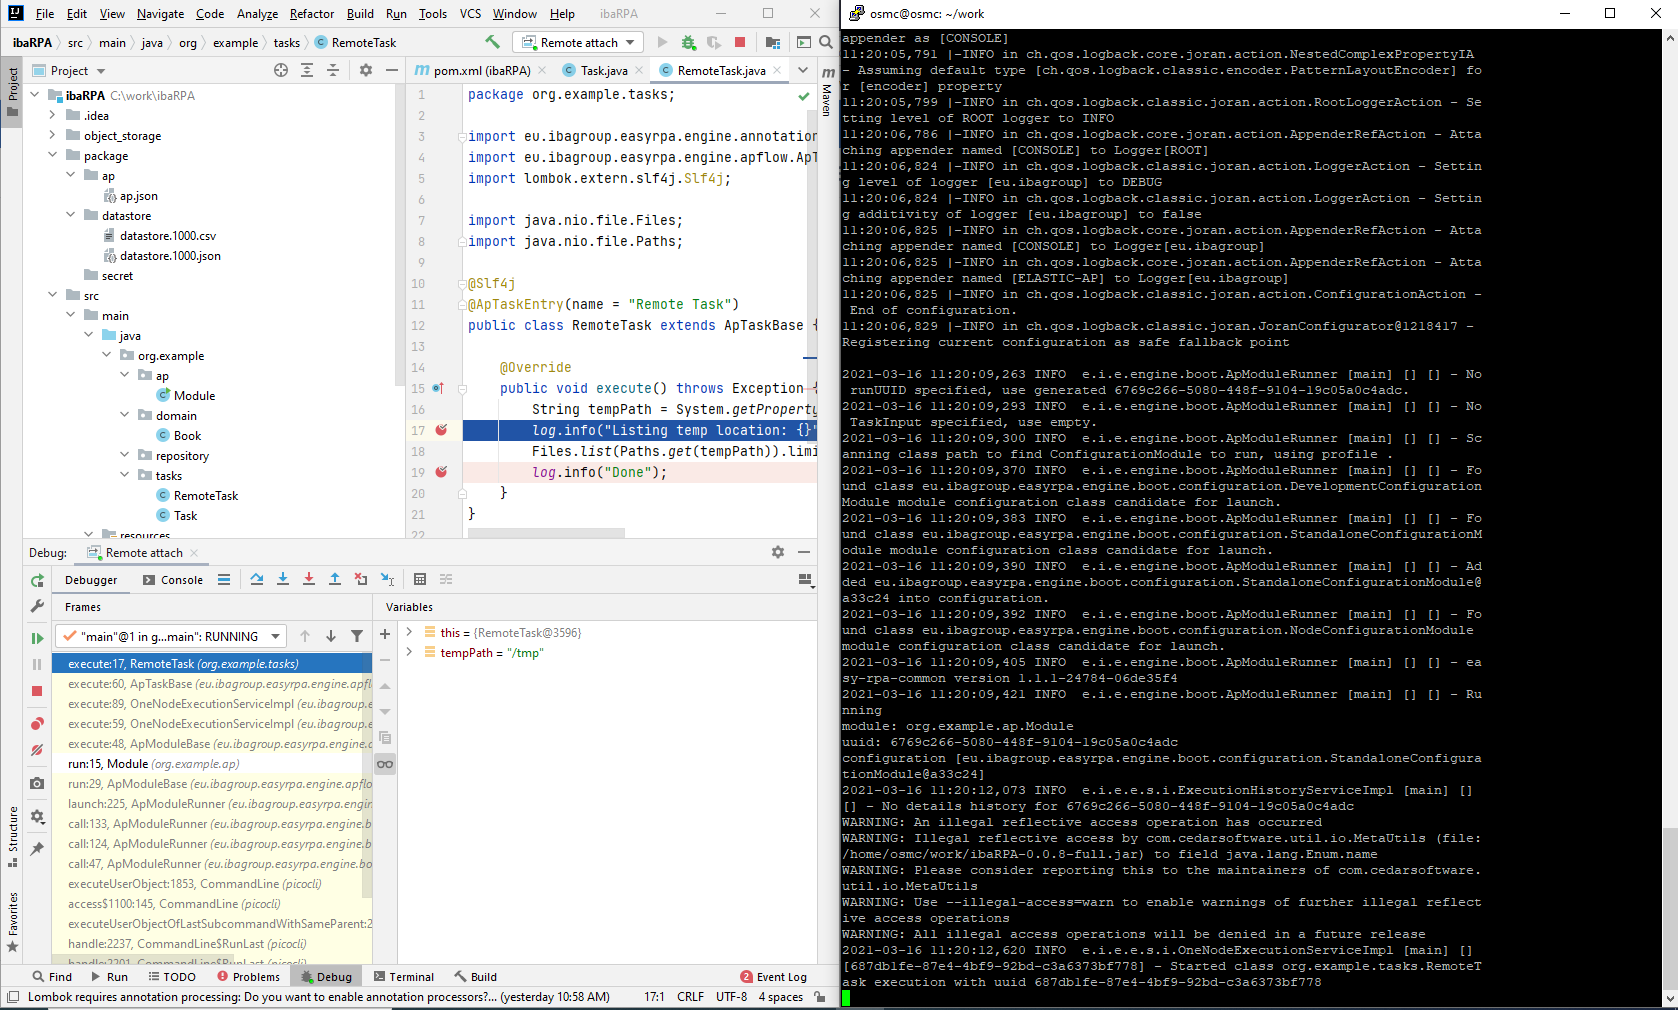
7.Launch the Run Configuration and wait until debugger is connected / suspend on the first break point: