Platform Metrics
Platform Metrics
Overview
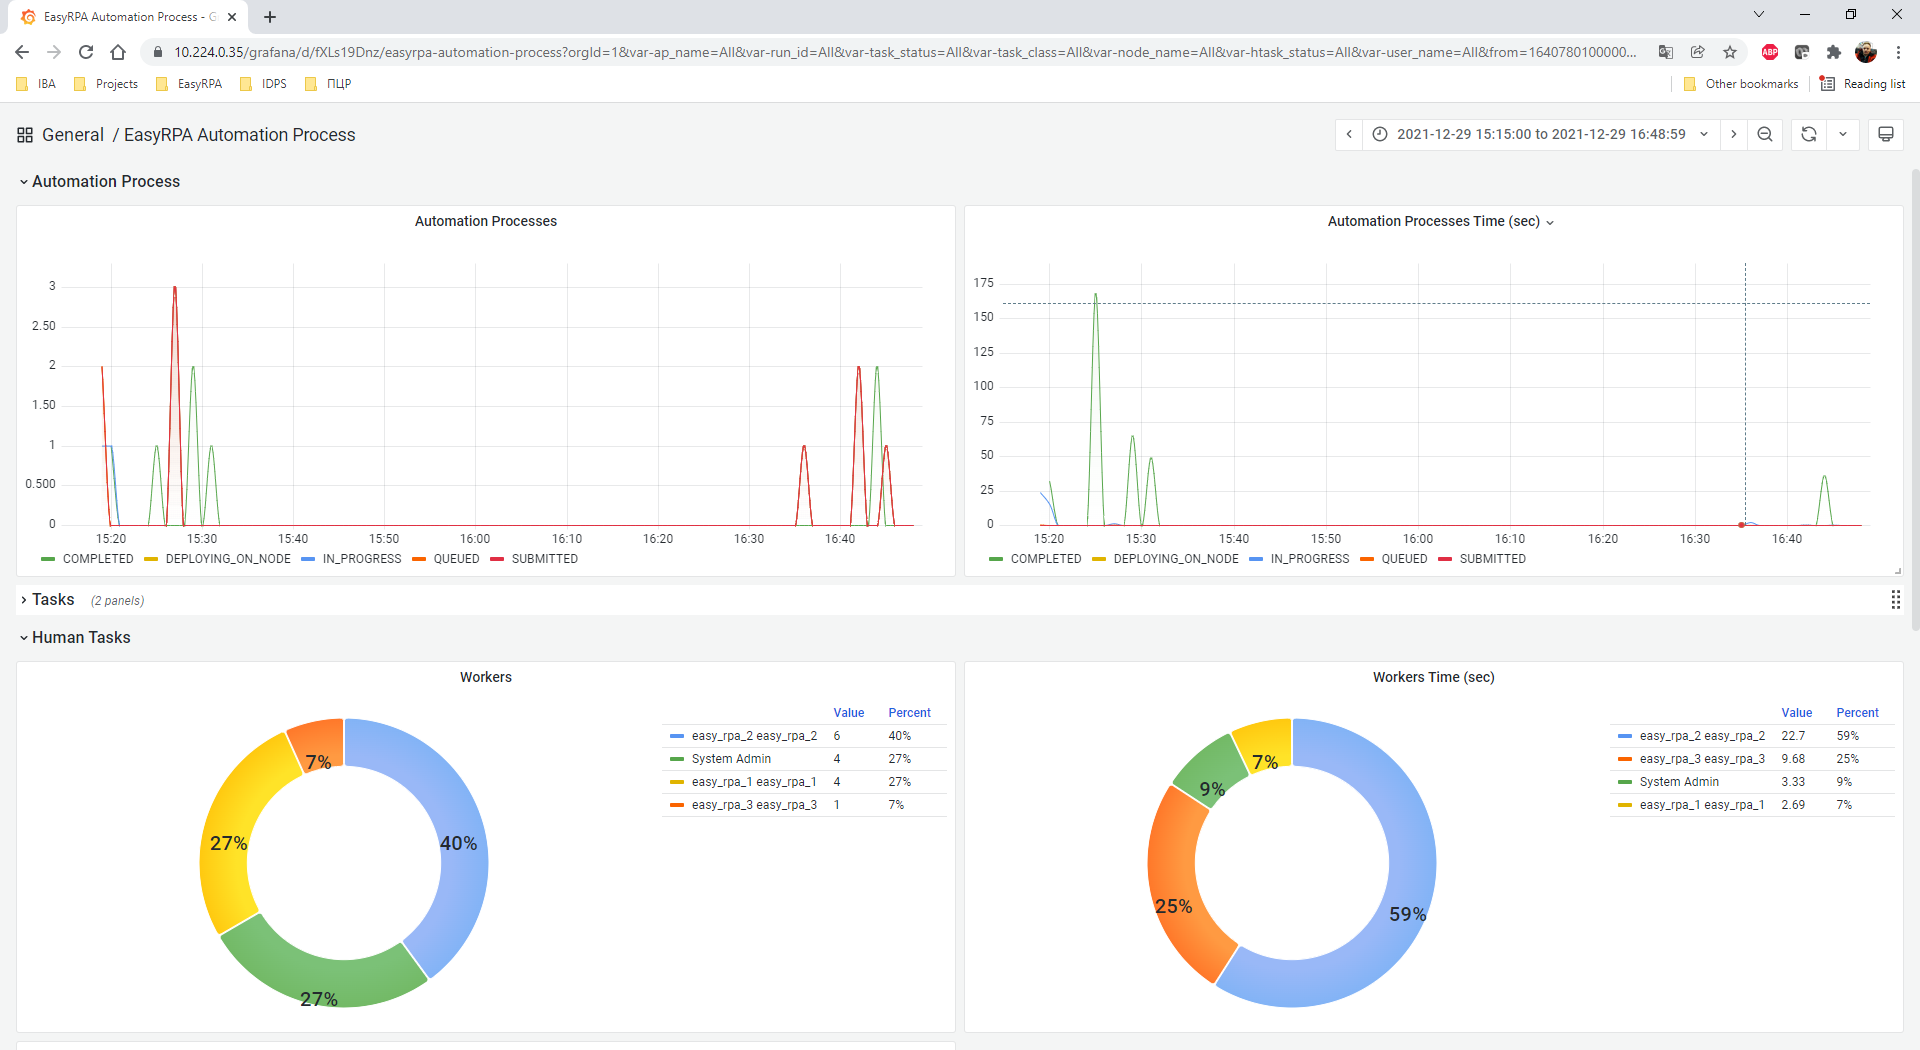
From version 2.3.0 platform stores various metrics into InfluxDB. Installation package contains Grafana UI and pre-defined dashboards for metrics representations.
https://<ControlServerAddress>/grafana/
Some of dashboards are intended to be presented in Control Server UI and some of them you can use as a sample template for you own dashboards.
Here are the metrics reference guide.
Task Run metrics
rpaplatform_task - counter
Triggers every time (ones), when Automation process run change its status. Value always 1.
rpaplatform_task_time - counter
Triggers every time (ones), when Automation process run change its status. Value contains milliseconds from the last status change.
Task run metrics tags
| tag | description |
|---|---|
| ap_id | Automation Process id. |
| ap_uuid | Automation Process UUID |
| ap_name | Automation Process name |
| run_id | Automation Process Run id. |
| run_uuid | Automation Process Run uuid. |
| task_uuid | Optional. Task UUID, if record represents task run. |
| task_class | Optional. Task class name, if record represents task run. |
| node_id | Optional. Node id, if node already assigned. |
| node_name | Optional. Node name, if node already assigned. |
| task_status | Automation Process Run status. SUBMITTED, QUEUED, DEPLOYING_ON_NODE, IN_PROGRESS, STOPPING, STOPPED, FAILED, COMPLETED, STOPPED_IDLE |
| task_type | task or module. Task or Automation Process run |
Human Task Metrics
rpaplatform_htask - counter
Triggers every time (ones), when Human Task change its status. Value always 1.
rpaplatform_htask_time - counter
Triggers every time (ones), when Human Task change its status. Value contains milliseconds from the last status change.
Human Task metrics tags
| tag | description |
|---|---|
| ap_id | Automation Process id. |
| ap_uuid | Automation Process UUID |
| ap_name | Automation Process name |
| run_id | Automation Process Run id. |
| run_uuid | Automation Process Run uuid. |
| task_uuid | Optional. Task UUID, if record represents task run. |
| task_class | Optional. Task class name, if record represents task run. |
| node_id | Optional. Node id, if node already assigned. |
| node_name | Optional. Node name, if node already assigned. |
| htask_status | Human Task status:
|
| user_name | Name of user who perform human task action. |
| user_id | Id of user who perform human task action. |
| doc_type_id | Human task document type id |
| doc_type_name | Human task document type name |
| workspace_group_id | Human task workspace group id |
| workspace_group_name | Human task workspace group name |
Node Metrics
rpaplatform_node_cpu - gauge
Triggers every minute with value = number of node CPUs.
rpaplatform_node_cpu_usage - gauge
Triggers every minute with value = node's cpu usage.
rpaplatform_node_memory_free - gauge
Triggers every minute with value = node's free memory.
rpaplatform_node_memory_total - gauge
Triggers every minute with value = node's total memory.
rpaplatform_node_free_ui_executors - gauge
Triggers every minute with value = free node's desktop executors.
rpaplatform_node_free_task_executors - gauge
Triggers every minute with value = free node's task executors.
Node metrics tags
| tag | description |
|---|---|
| node_id | Node id. |
| node_name | Node name. |
rpaplatform_queue - counter
Triggers for every OCR or ML queue operation.
Node metrics tags
| tag | description |
|---|---|
| ap_id | Automation Process id. |
| ap_uuid | Automation Process UUID |
| ap_name | Automation Process name |
| run_id | Automation Process Run id. |
| run_uuid | Automation Process Run uuid. |
| queue_name | Queue name: ML, OCR |
| queue_operation | Queue operation: send, receive |
Docker Container metrics
Telegraf docker plugin is using to collect metrics. Please refer to the plugin documentation for metric specification.
https://github.com/influxdata/telegraf/tree/master/plugins/inputs/docker
ActiveMQ metrics
Telegraf ActiveMQ plugin is using to collect metrics. Please refer to the plugin documentation for metric specification.
https://github.com/influxdata/telegraf/tree/master/plugins/inputs/activemq
ML Container metrics
Fron version 3.4.0 the ML container has the following metrics:
rpaplatform_ml_event - counter
Triggers every time (ones), when queue item changes it status. Value always 1.
| tag | description |
|---|---|
| host | The ml container host name |
| message_id | The ActiveMQ message id |
| message_uuid | An unique message id assigned to message by ML container |
| message_task_uuid | The task UUID of the queue item assigned by Control Server |
| message_type | The CS message type, train or process |
| event | A event has been triggered for the message. Has the following values:
|
rpaplatform_ml_state
Triggers one per SLEEP_INTERVAL, and has values this container state:
| tag | description |
|---|---|
| host | The ml container host name |
| field | description |
|---|---|
| RECEIVED | The count of received queue items from the last event. |
| PROCESSING | The count of processing queue items from the last event. |
| ERROR | The count of error queue items from the last event. |
| SENT | The count of sent queue items from the last event. |
rpaplatform_ml_openai_usage
Triggers every time (ones), when OpenAI model receives and LLM response with token usage.
| tag | description |
|---|---|
| host | The ml container host name |
| message_id | The ActiveMQ message id |
| message_uuid | An unique message id assigned to message by ML container |
| message_task_uuid | The task UUID of the queue item assigned by Control Server |
| message_type | The CS message type, train or process |
| field | description |
|---|---|
| prompt_tokens | The prompts token usage for the processed document |
| completion_tokens | The completion token usage for the processed document |
| total_tokens | The total token usage for the processed document |