Debug AP on remote node with Control Server
Debug AP on remote node with Control Server
Overview
In many cases when you can not setup client applications on developer machine, it could be possible to check automation run on remote node. Node runs Automation Process as separate java process, so we can use standard Java debugging approach for this.
Specify debug flags on node
Go to the node configuration and setup required parameters:
| Name | Parameter | Default value |
|---|---|---|
| JAVA_DEBUG | Enable or disable AP debug | n |
| JAVA_DEBUG_PORT | Specifies ranges for debug port in format <number> or <number>-<number>. Node will use this port ranges to launch debugging. | 1044-65535 |
| JAVA_DEBUG_SUSPEND | Suspend target JVM if debug is on. | n |
| JAVA_DEBUG_HOST | Host to listen on. localhost by default | localhost |
| JAVA_DEBUG_CLASS_PATTERN | A task class name filter. If defined the debug will be switched on only for runs with the specified task class. | none |
In AP log following line will appear
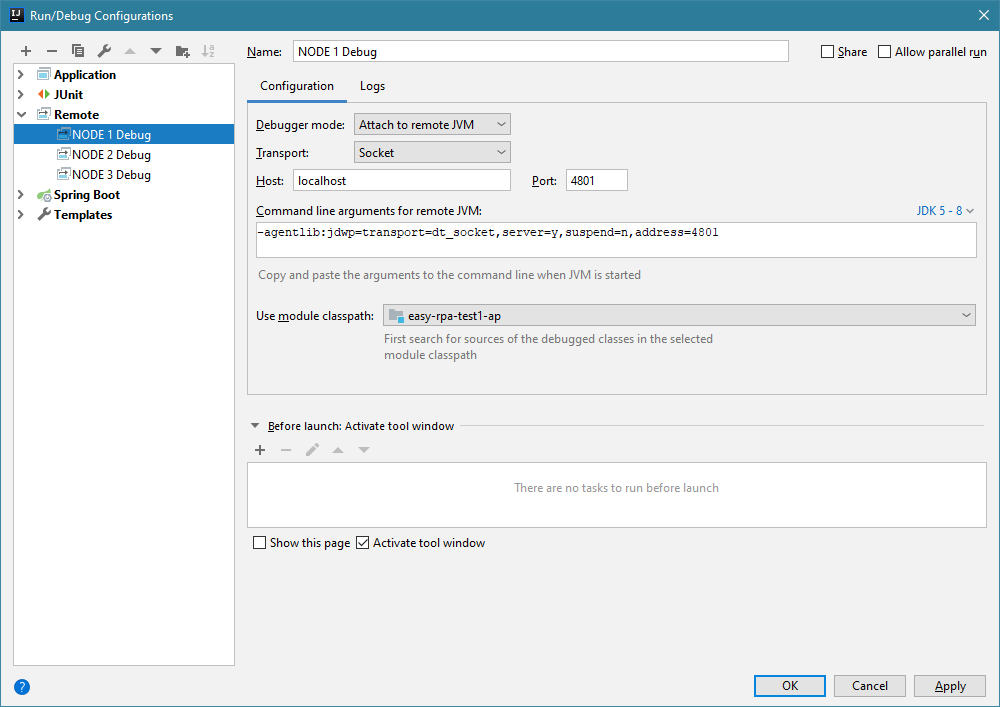
-agentlib:jdwp=transport=dt_socket,server=y,suspend=n,address=1050
Address parameter is calculated port number debugger listening on.
Connect remote debugger
In your IDE setup remote java debug launch configuration. For IDEA it looks like:
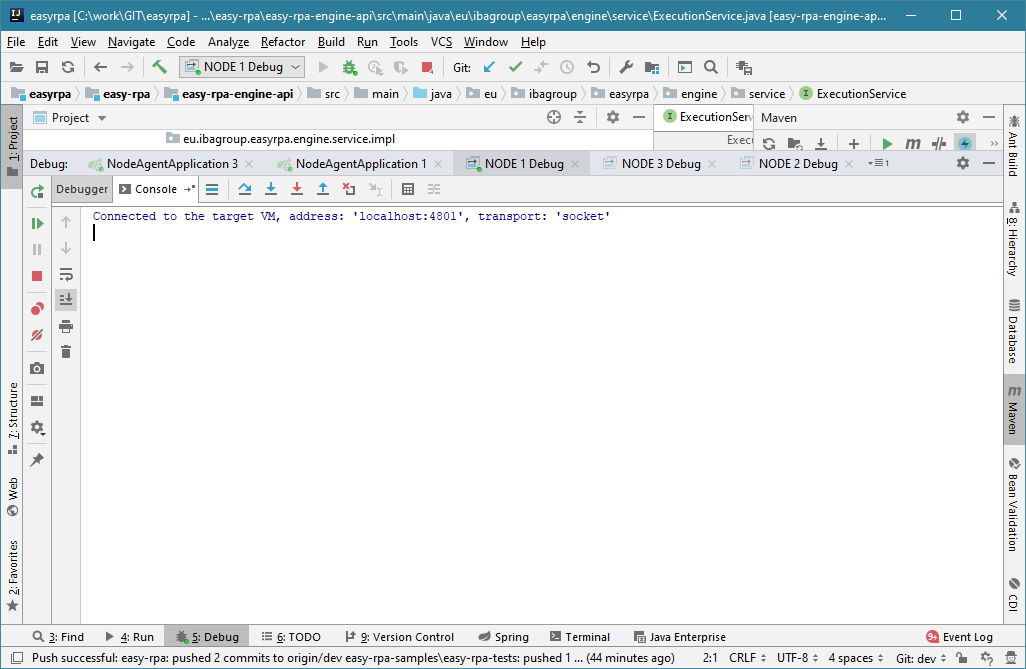
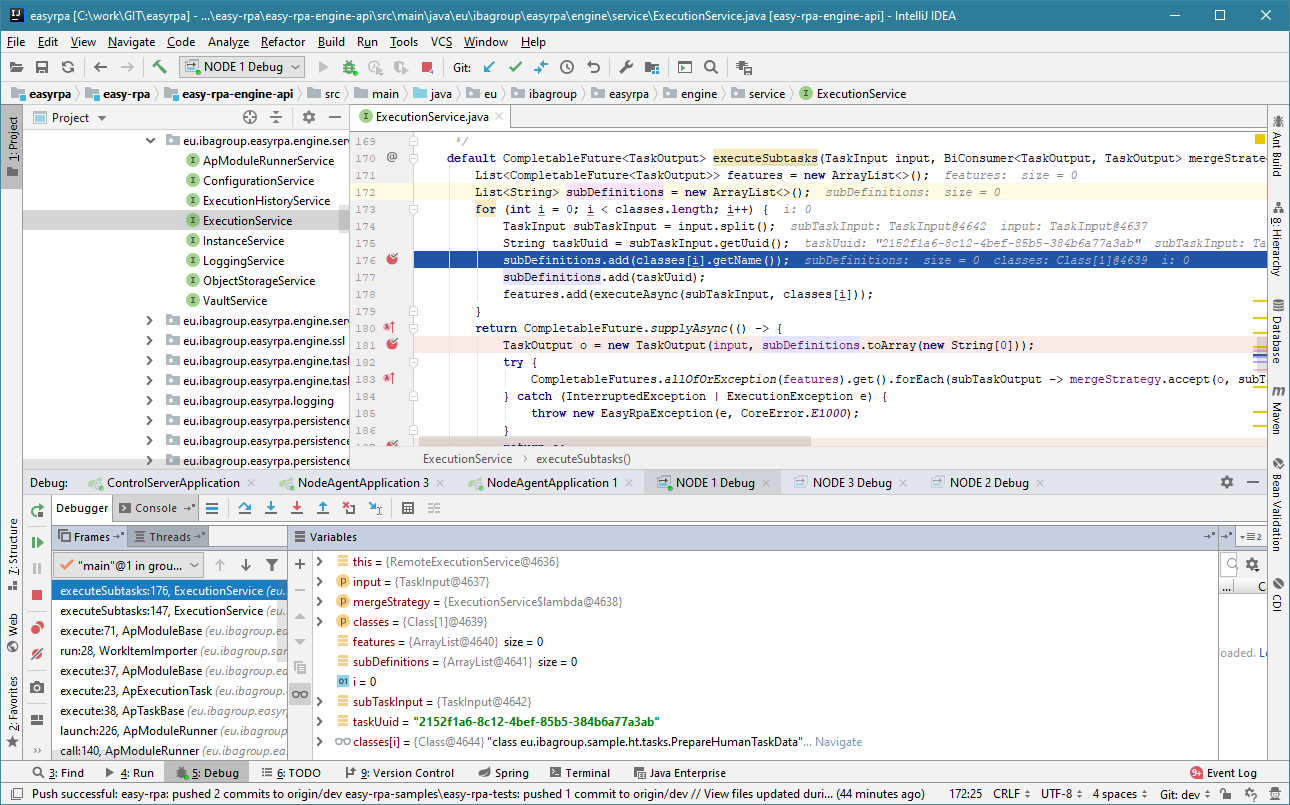
Observe node logs and as soon as the message of connection waiting appears, launch the debugger configuration: